Software Tools and Services for Traders
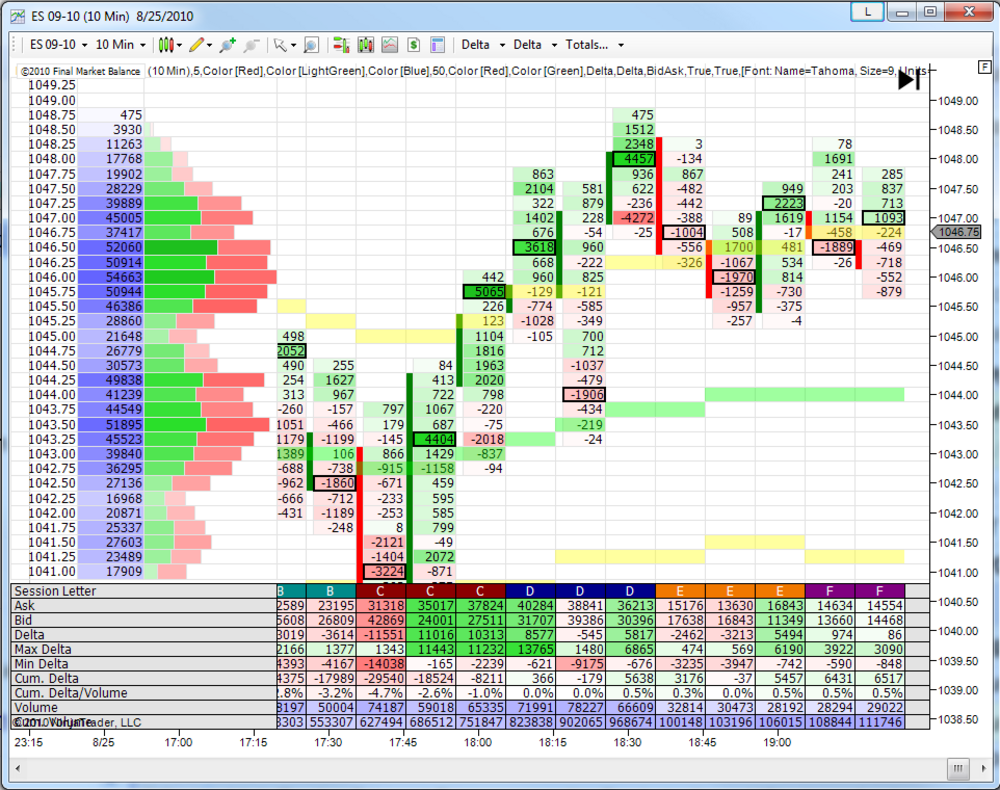
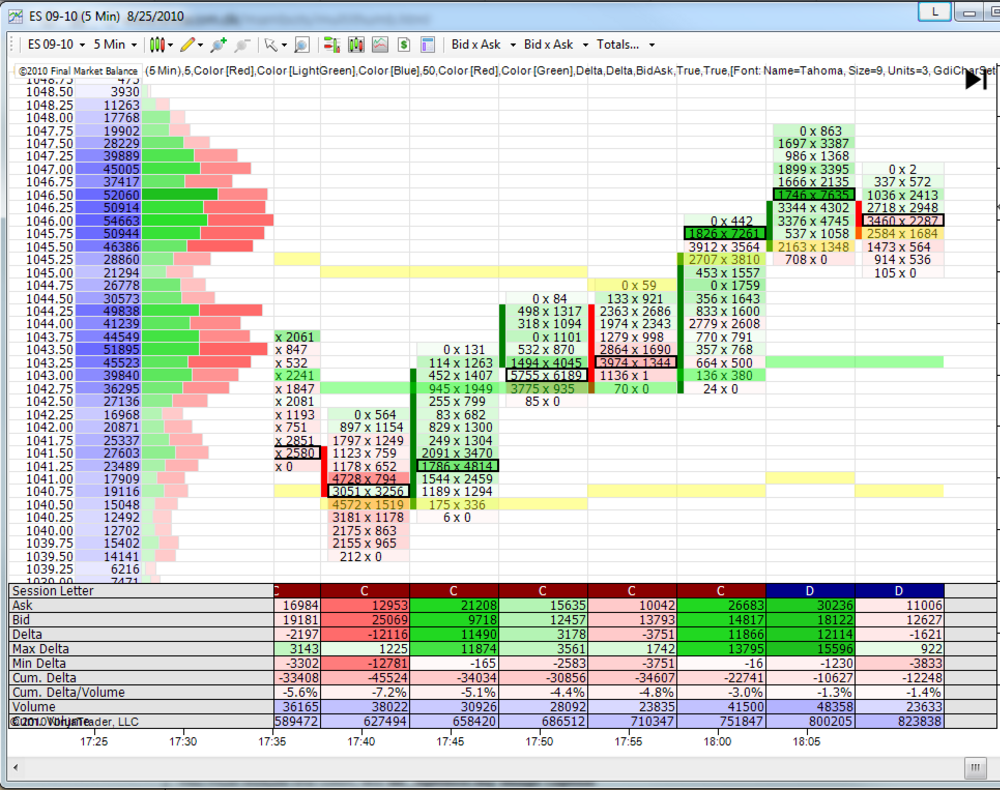
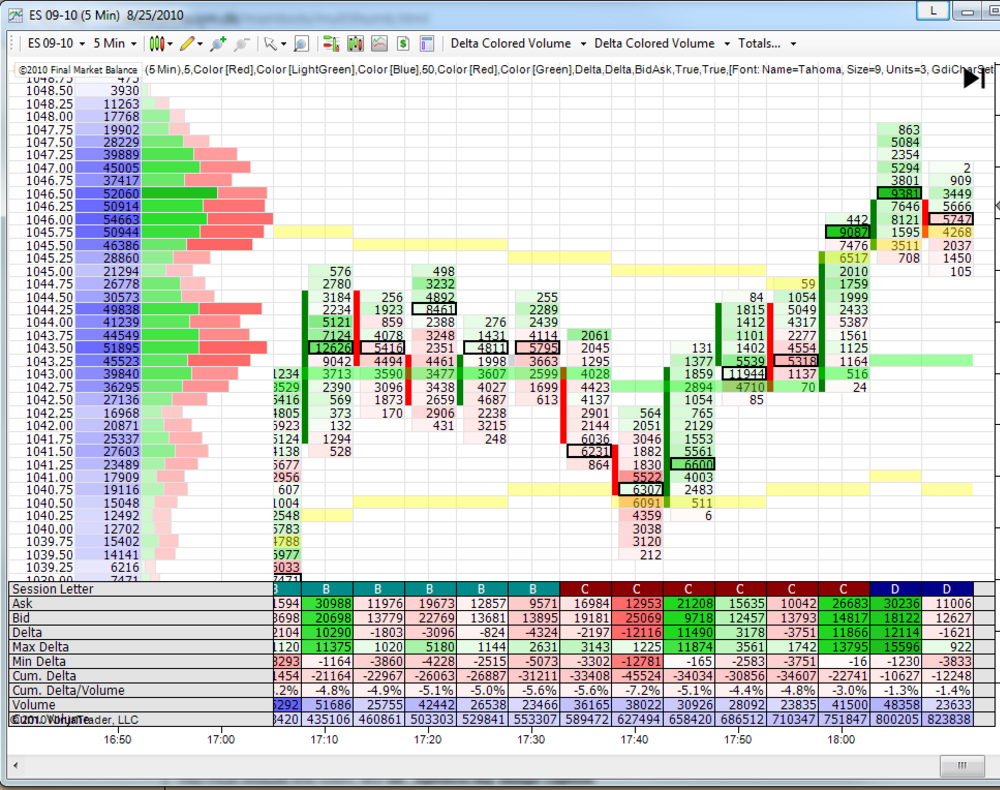
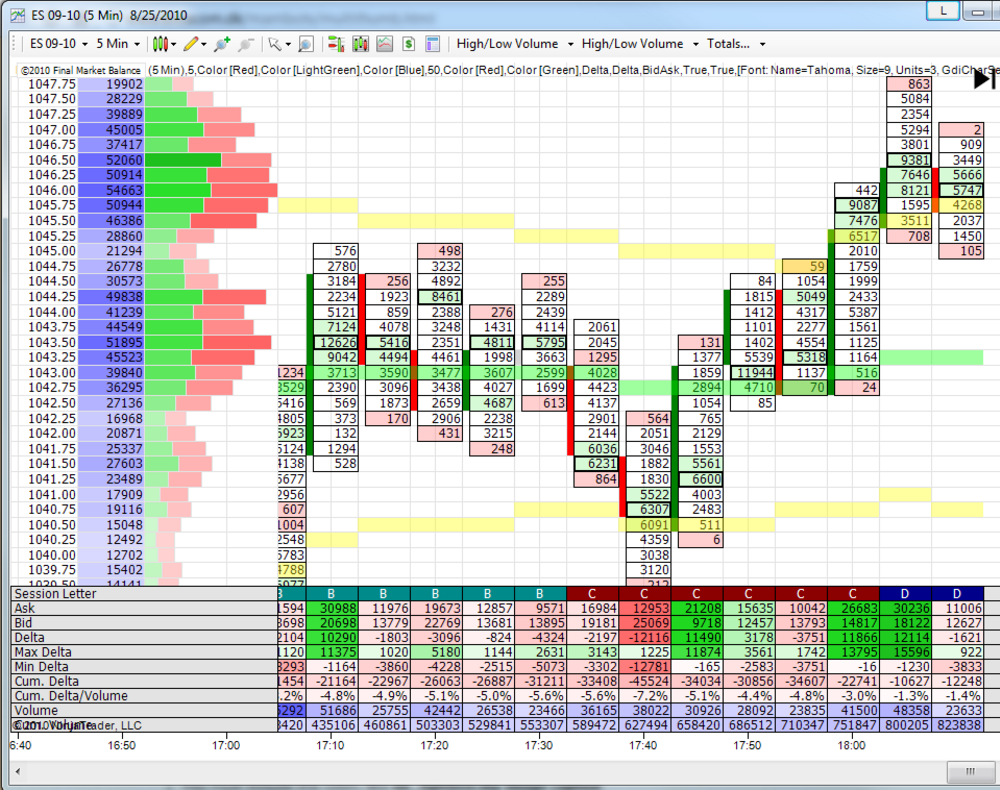
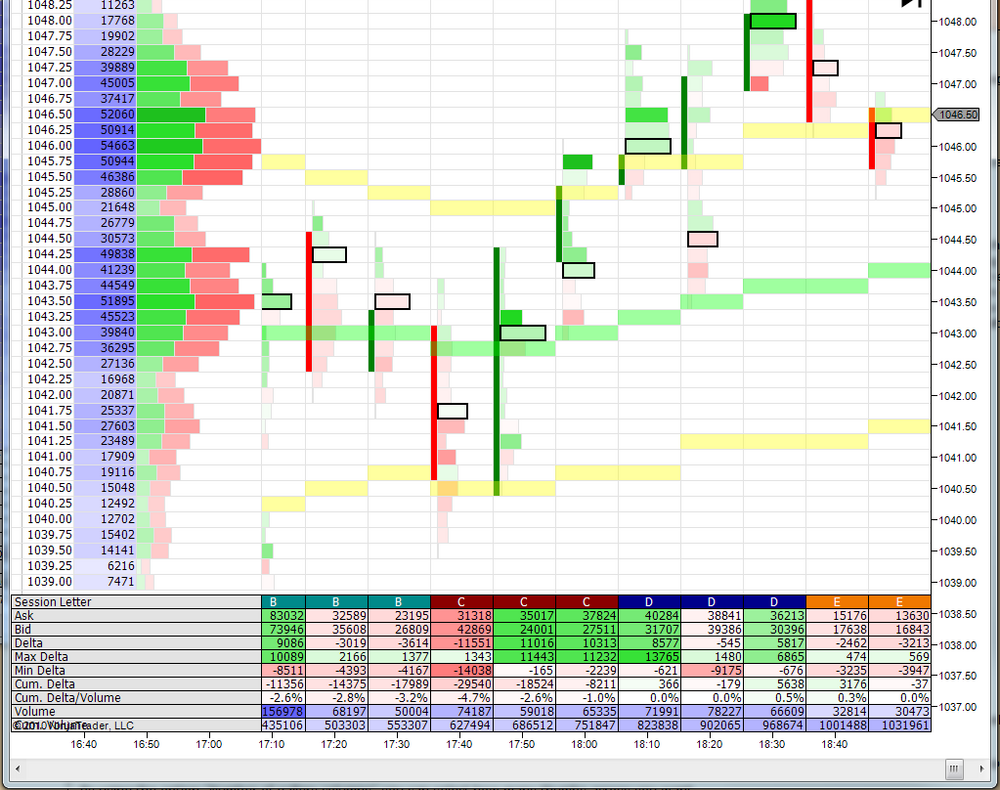
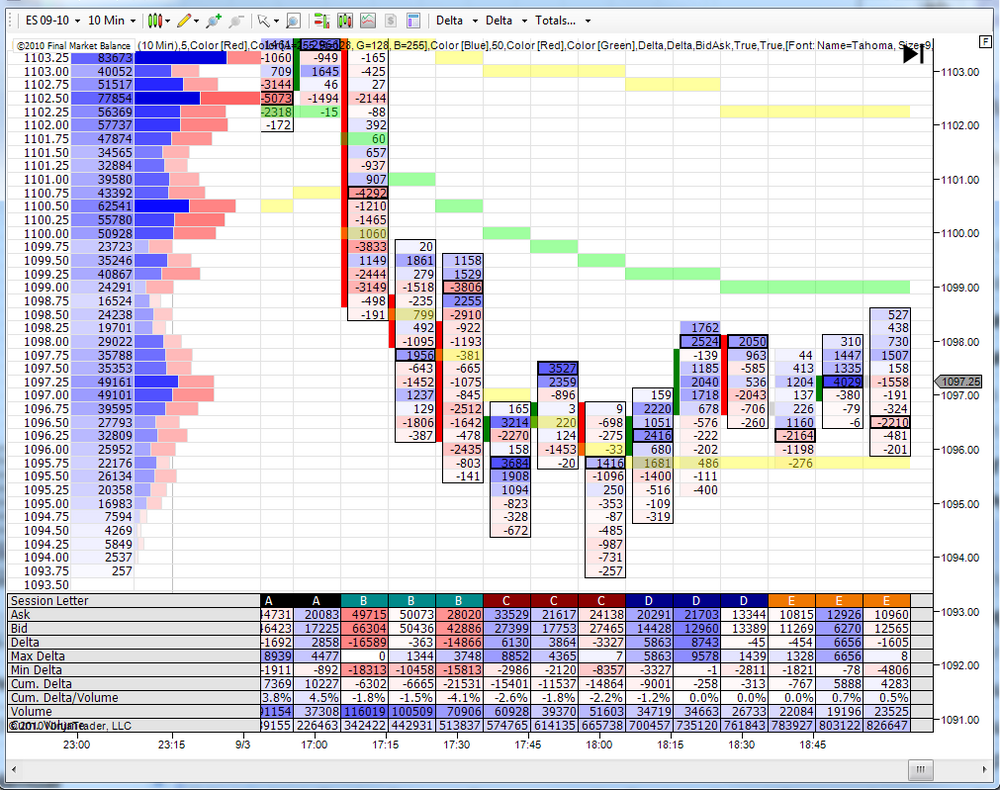
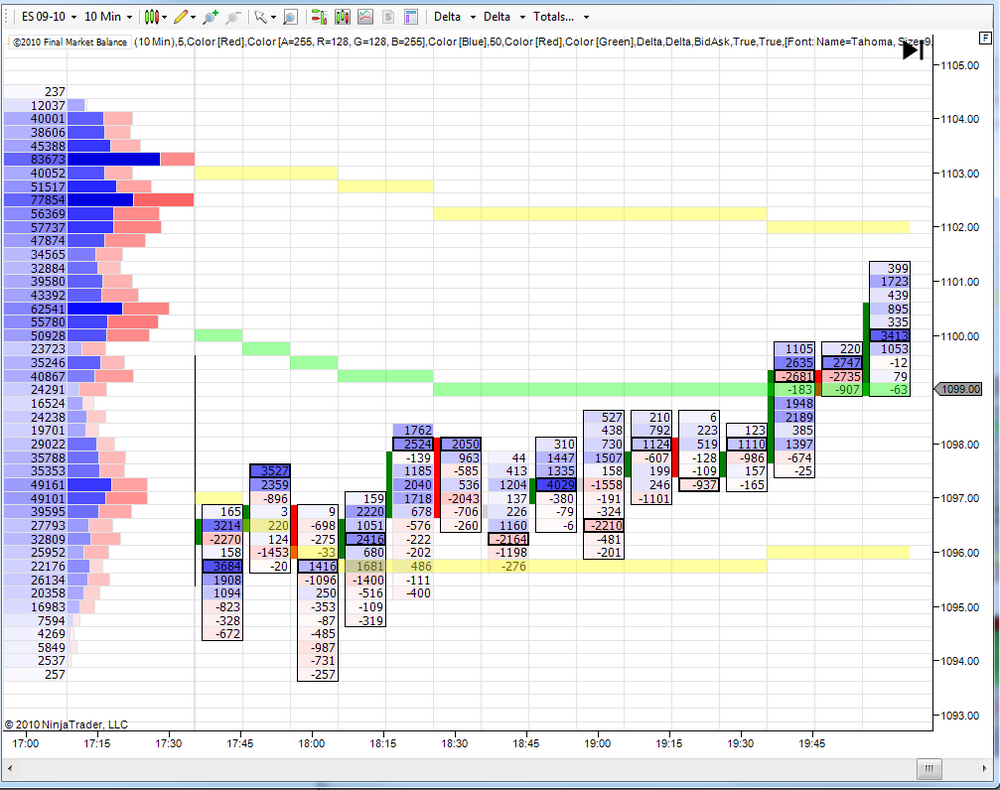
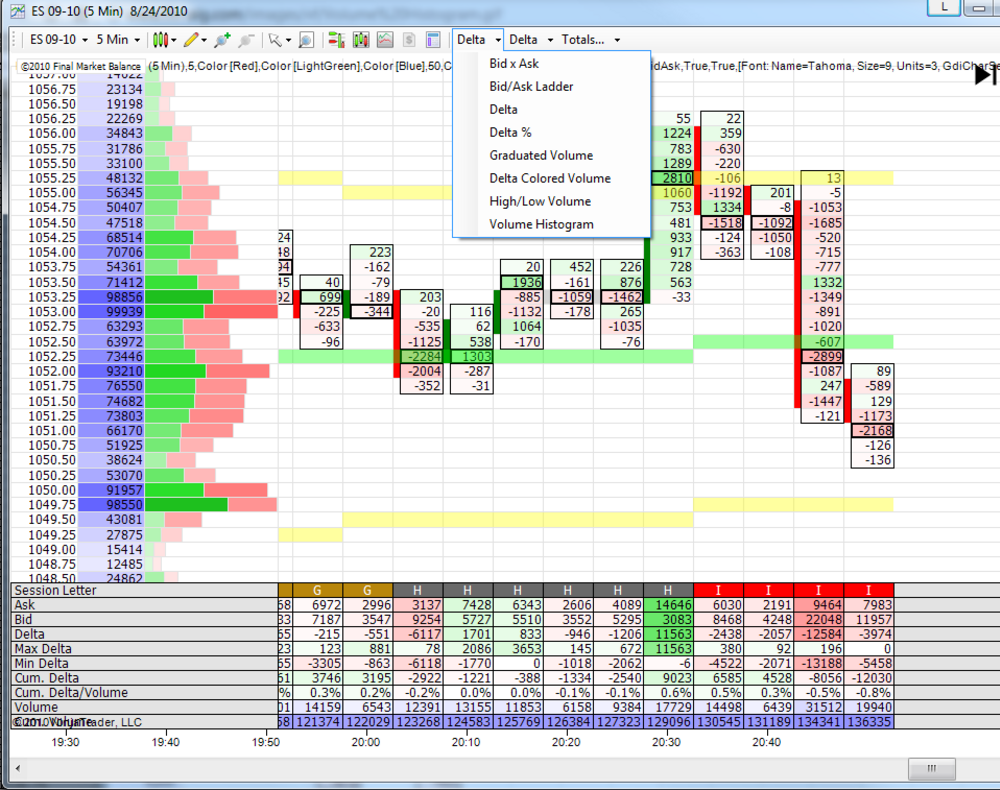
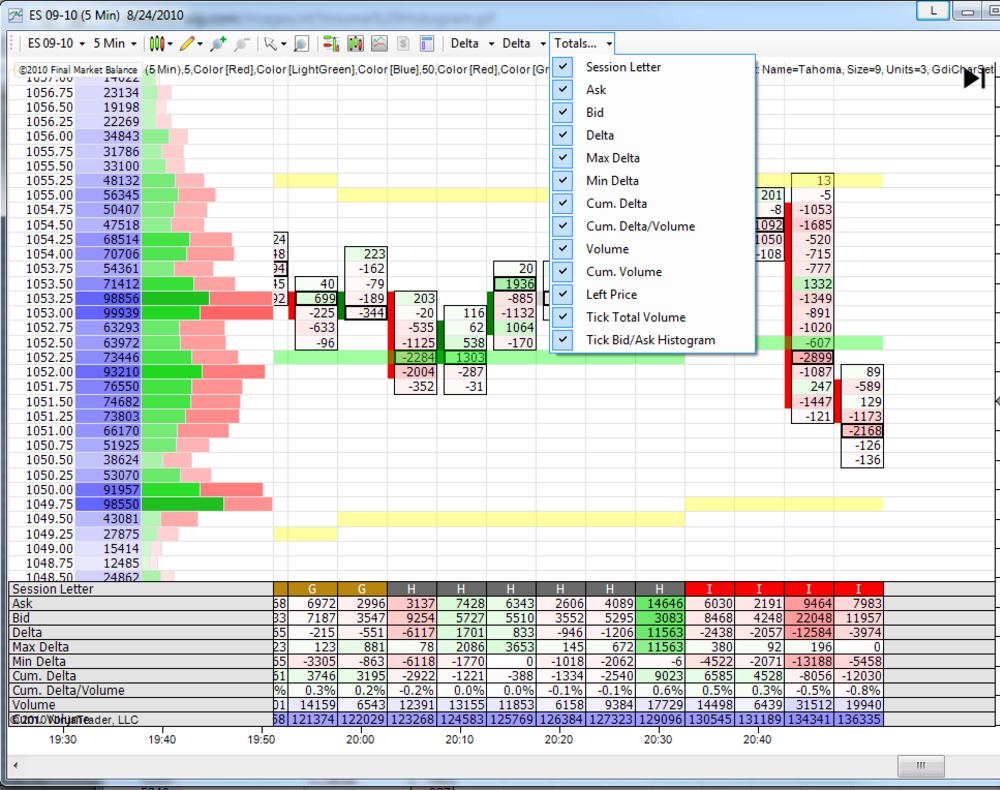
Final MarketBalance
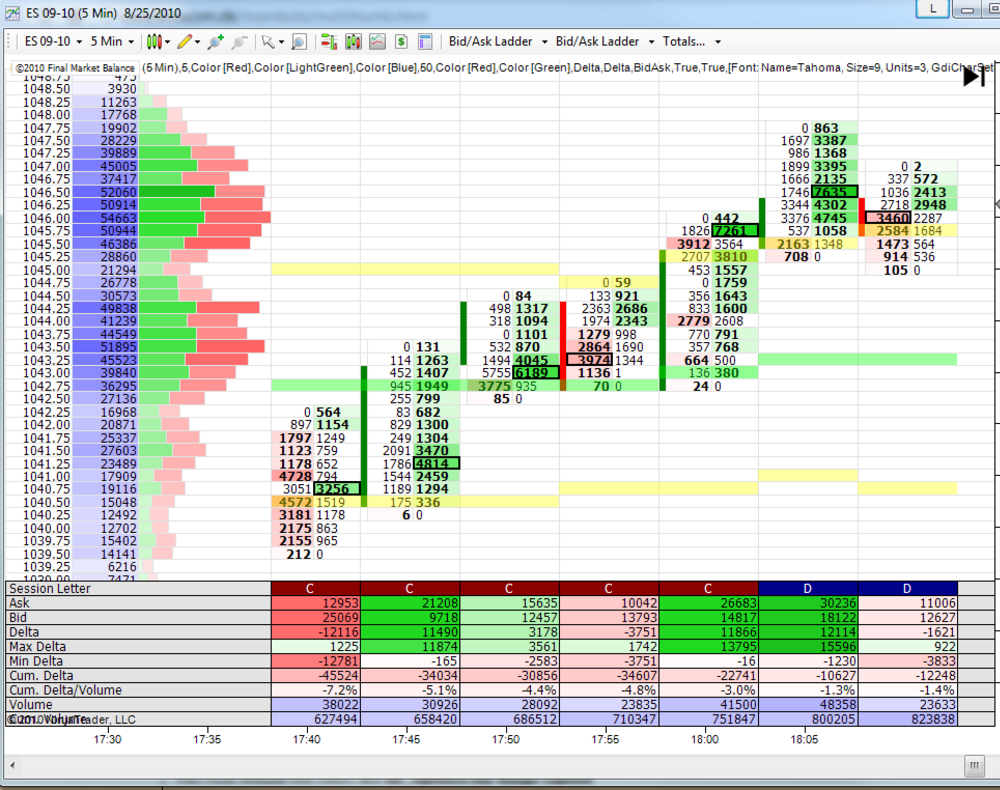
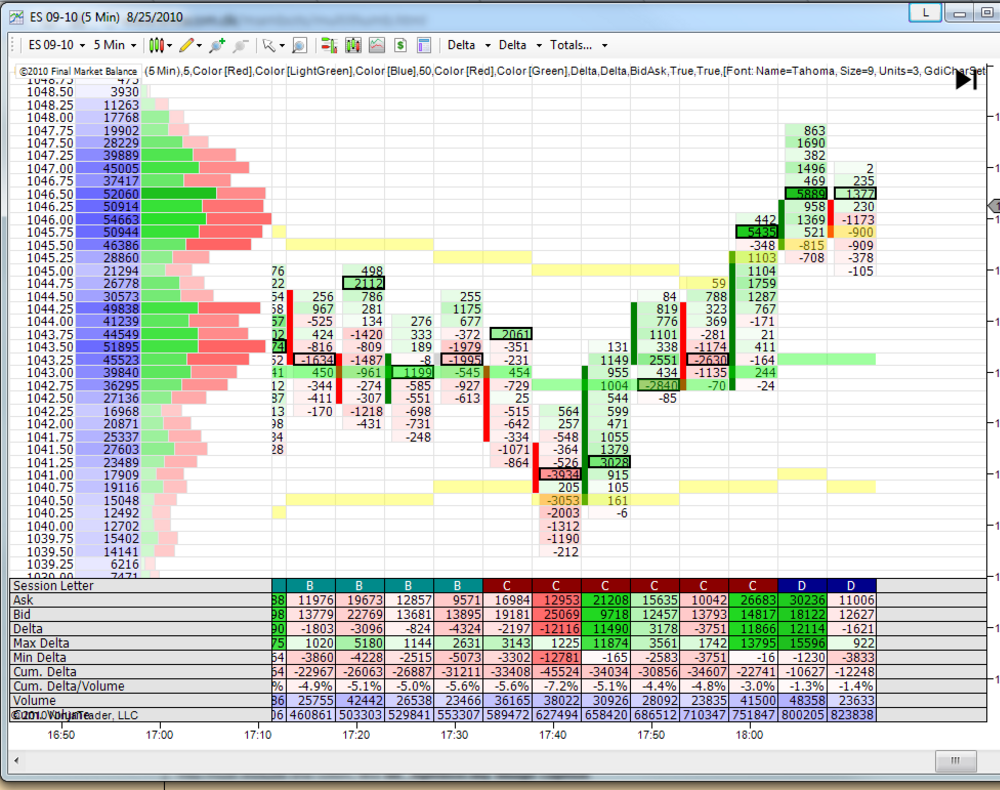
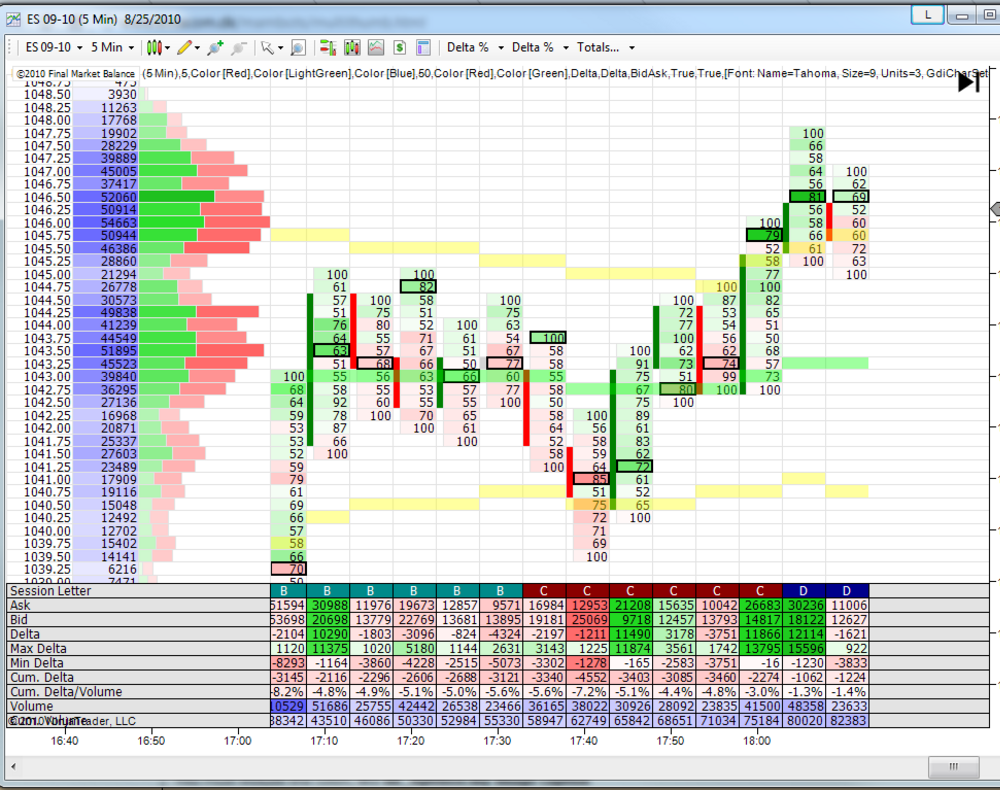
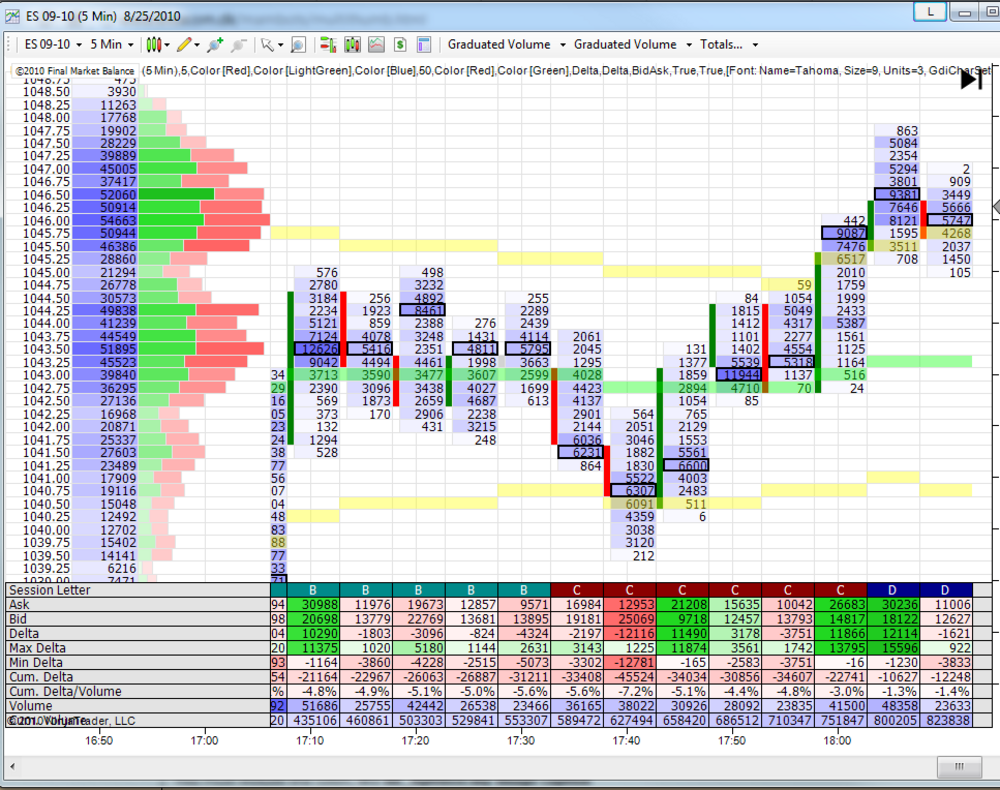
Final MarketBalance is a unique way to view prices, bid, ask and volume together on the same chart while showing the relation between market powers as they change during the trading session.
- Install Package for NinjaTrader 8 - Beta (Include 14 days free trial)
- Install Package for NinjaTrader 7 (Include 14 days free trial)
- User Guide
- Subscribe for $59/Month (through PayPal)
- Buy lifetime license for $250 x 3 monthly payments (through PayPal)
- Frequently Asked Questions
Screen Shots
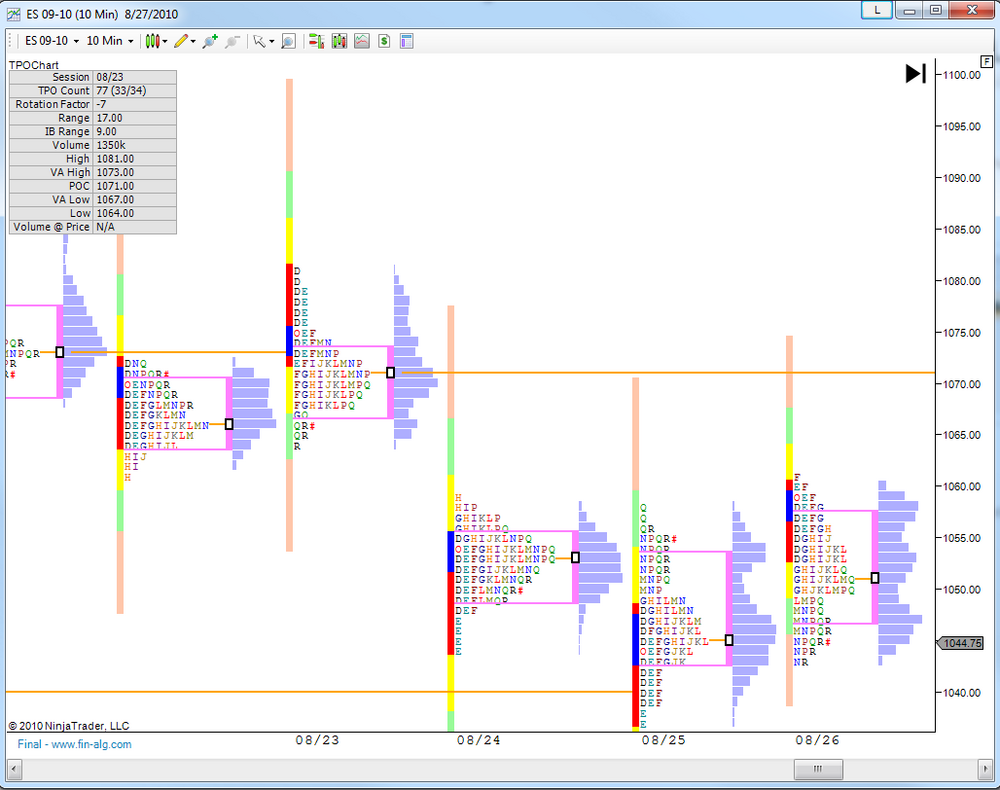
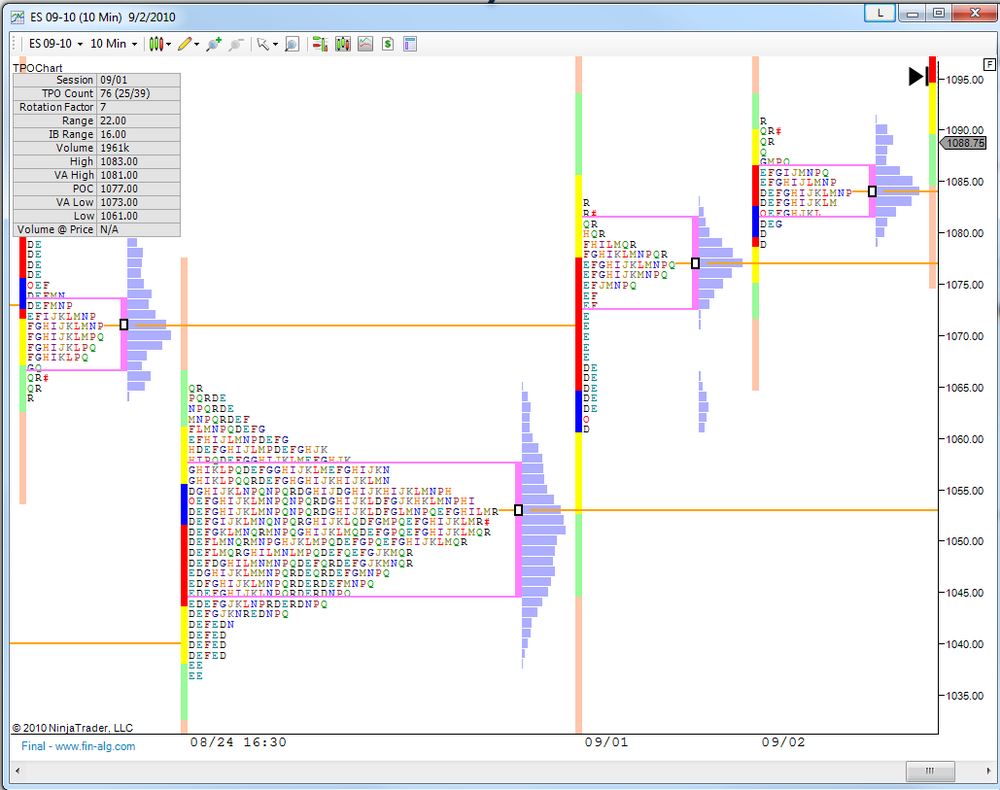
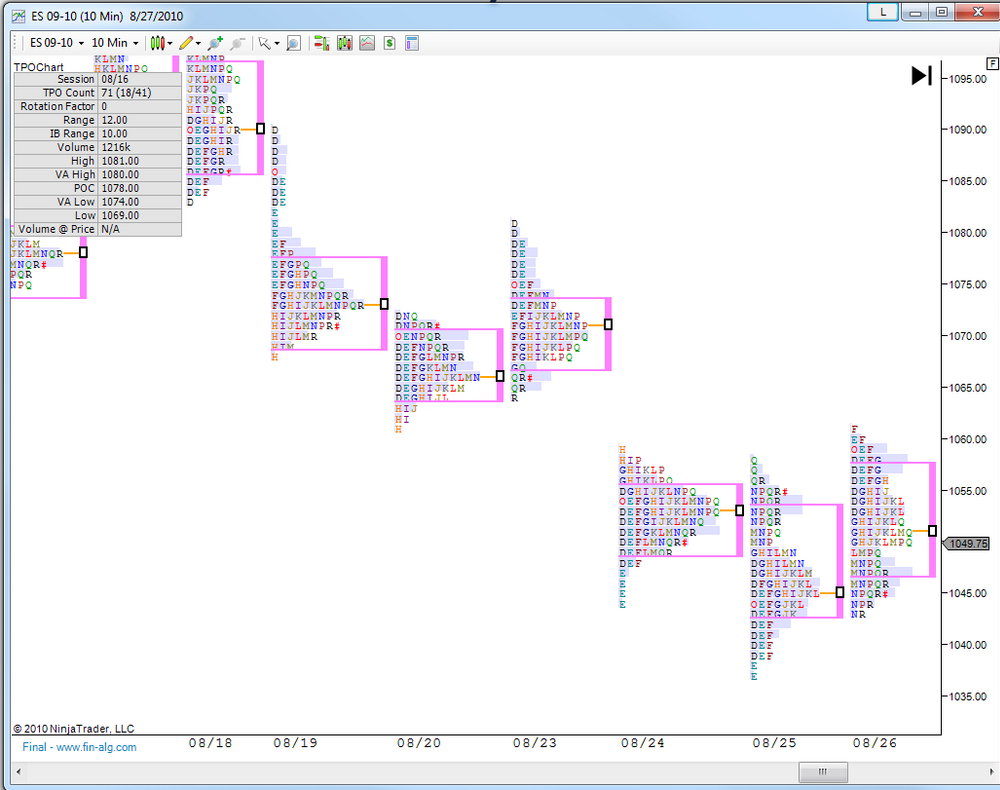
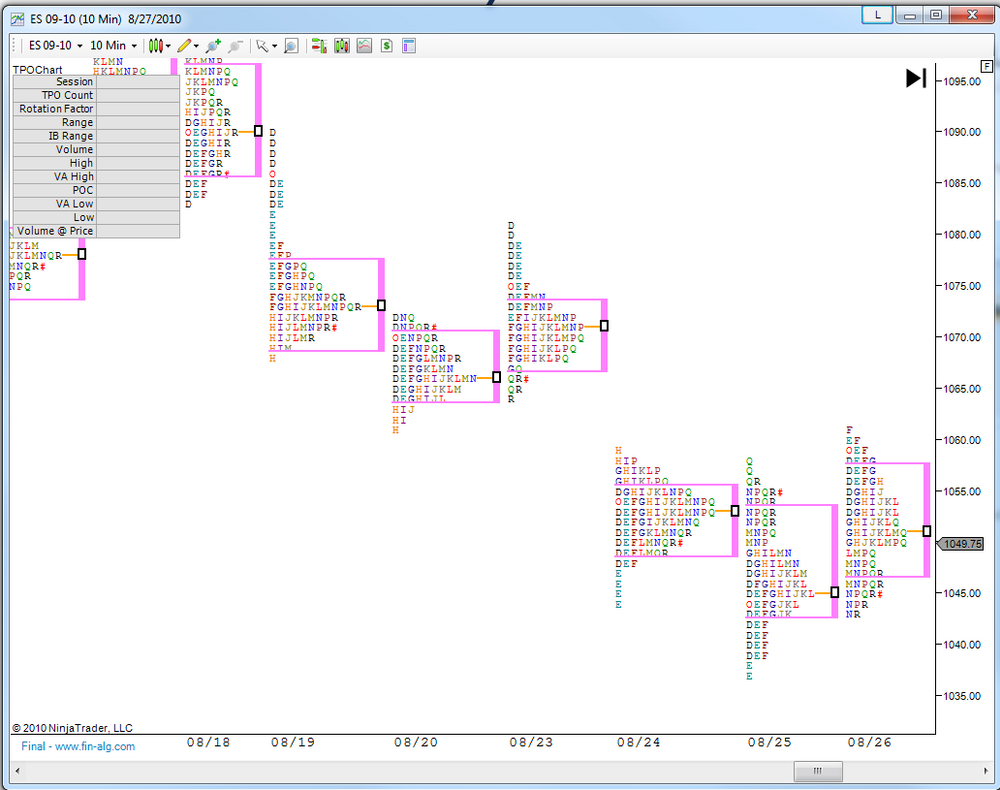
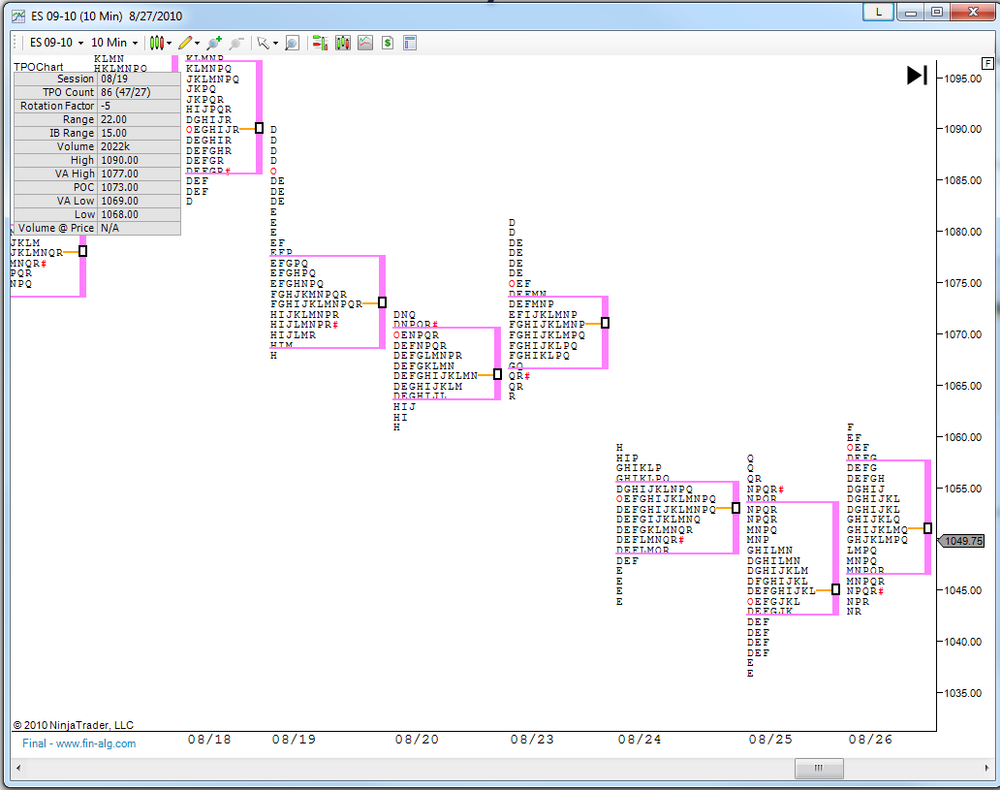
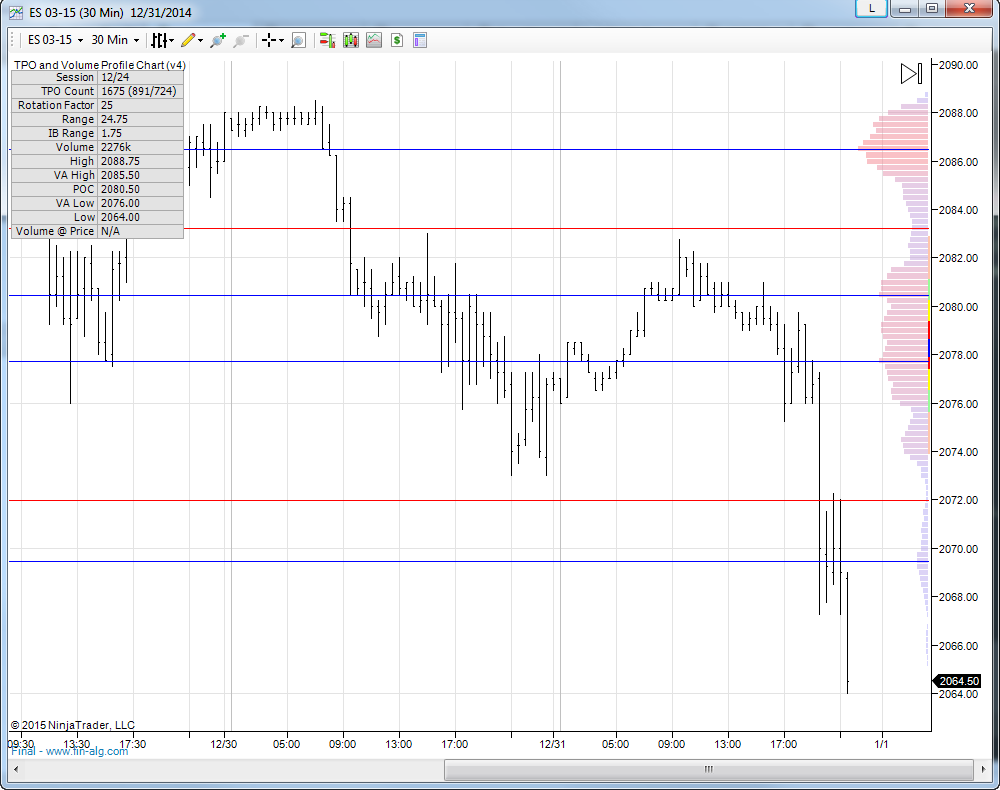
TPO and Volume Profile Chart
Provides a complete TPO (AKA MarketProfile) and Volume chart solution that is integrates fully with NinjaTrader Chart Trader, other indicators and chart drawing tools.
- Install Package for NinjaTrader 8 - Beta (Include 7 days free trial)
- Install Package for NinjaTrader 7 (Include 7 days free trial)
- Purchase now for $269 (through PayPal)
- Frequently Asked Questions
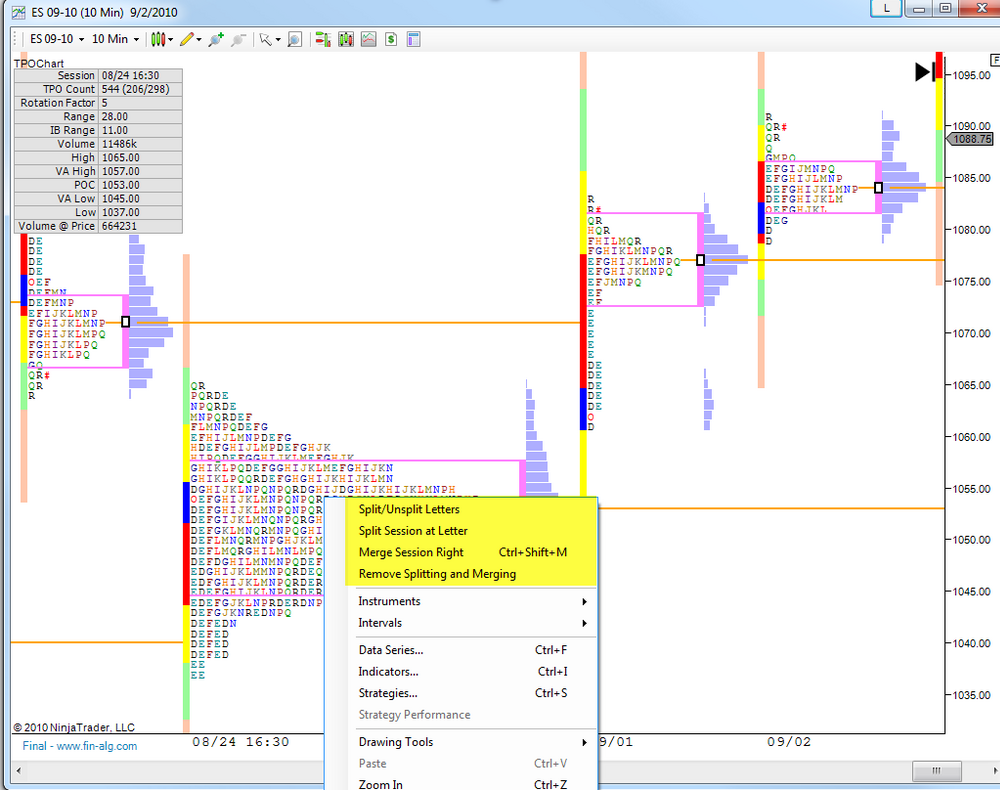
Main Features
- Complete TPO and Volume Chart Implementation.
- Fully integrated with NinjaTrader Chart Trader , other indicators (applicable only for some indicators) and chart drawing tools. Use NinjaTrader Chart tool bar, Context Menu and Hot Keys for Fast Access to Operations.
- Flexible Session Hours Configuration (e.g. Globex, RTH) Using NinjaTrader 7 Session Manager.
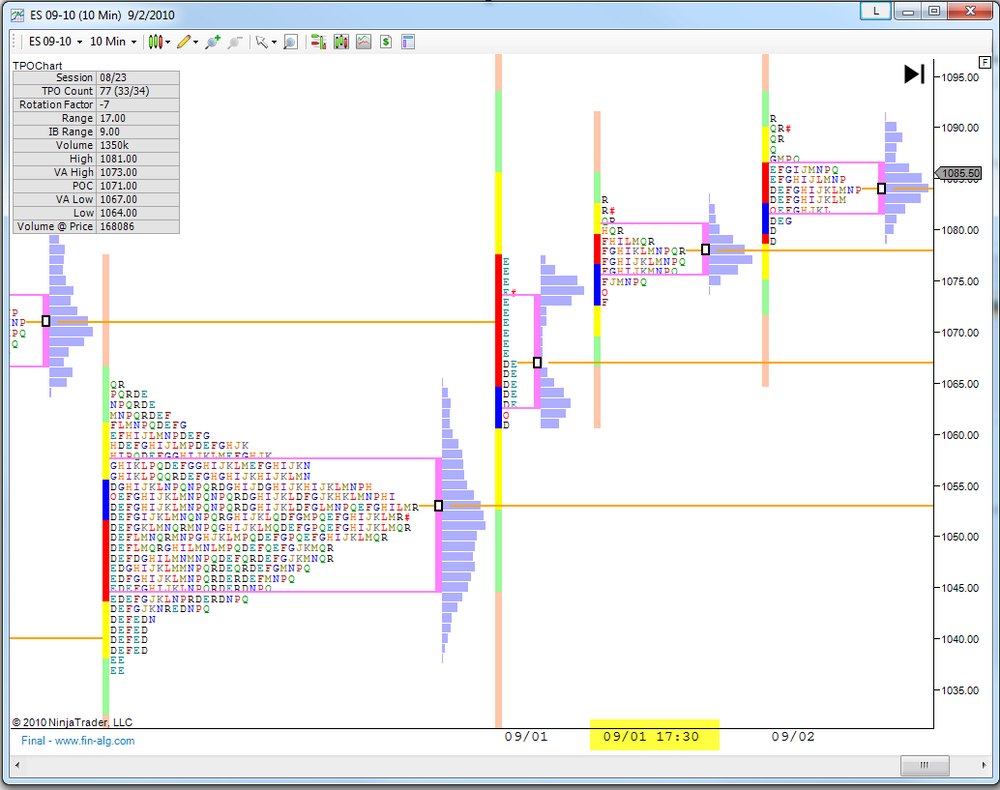
- Splits Sessions into Multiple Profiles and Merges Multiple Sessions to One Profile.
- HVN/LVN, 2nd Value Area, Single Print, Long term profiles and more
Screen Shots
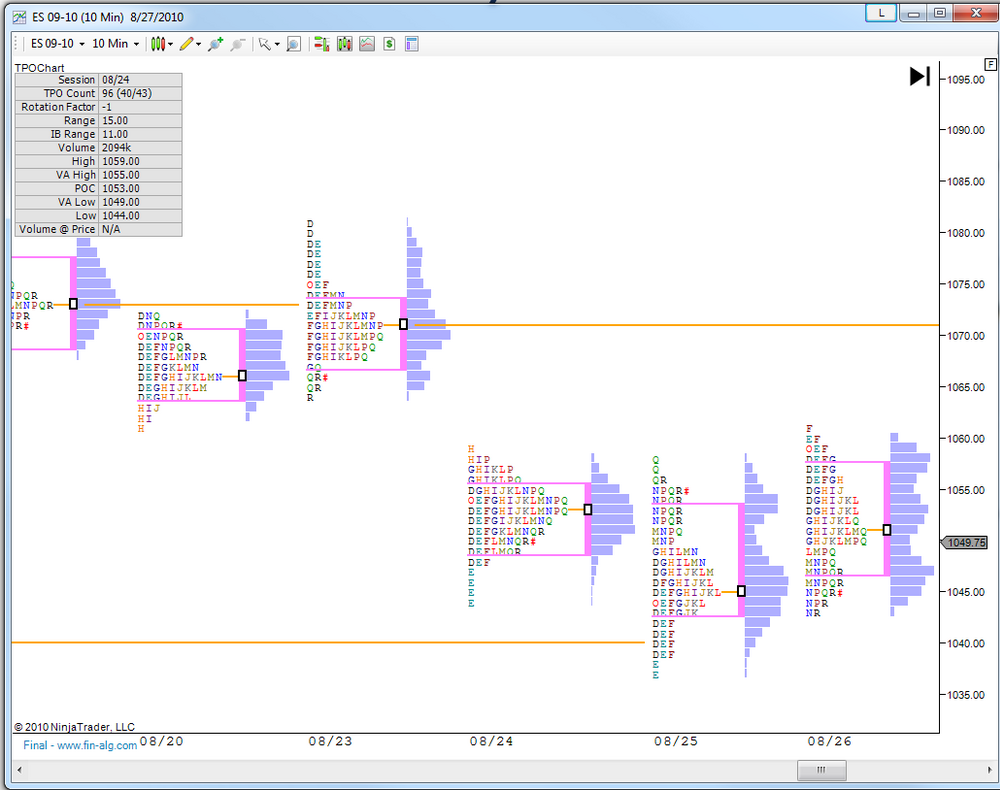
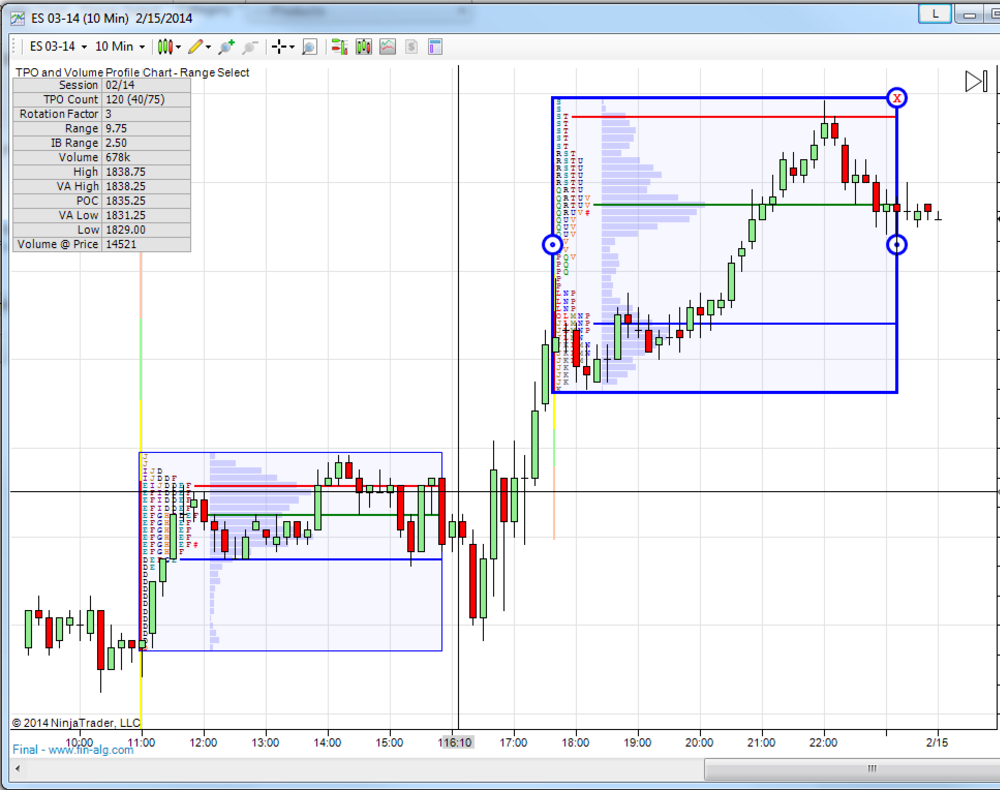
TPO and Volume Profile Chart - Range Select
Manual draw and adjust profiles.
- Install Package for NinjaTrader 8 - Beta (Include 7 days free trial)
- Install Package for NinjaTrader 7 (Include 7 days free trial)
- Purchase now for $189 (through PayPal)
Main Features
- Manually draw custom sessions on any chart.
- Draw multiple sessions, Delete and adjust any session.
- Easy session modification with mouse drag & drop.
- Automatically save and reload plotted sessions.
Screen Shots
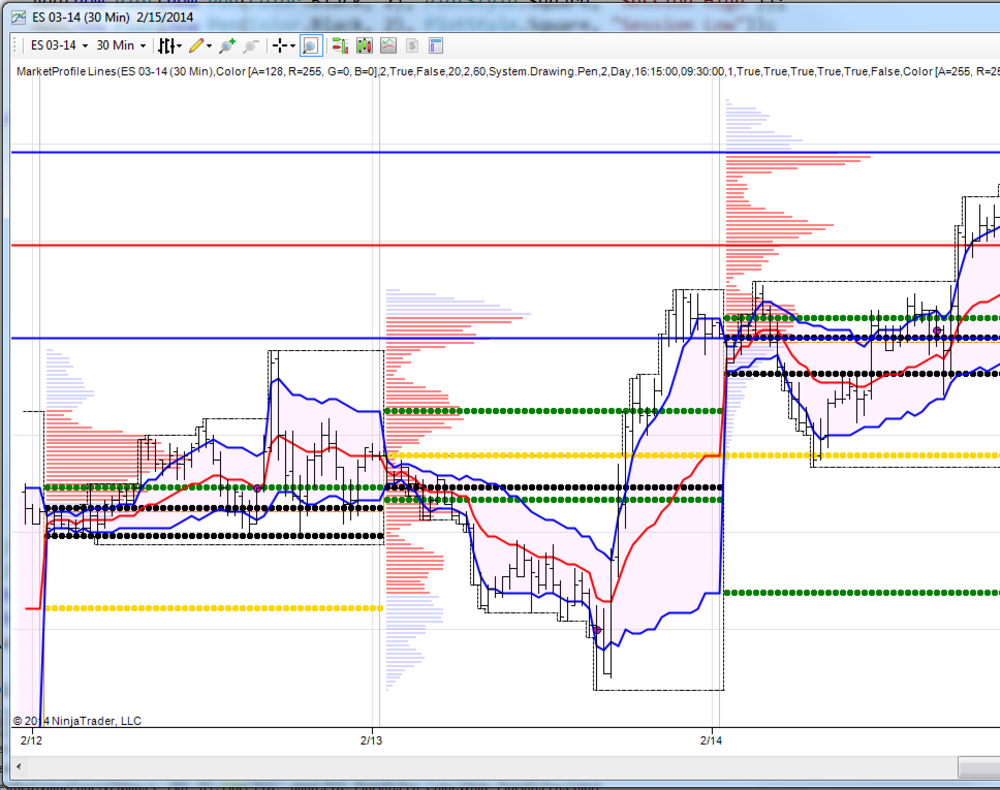
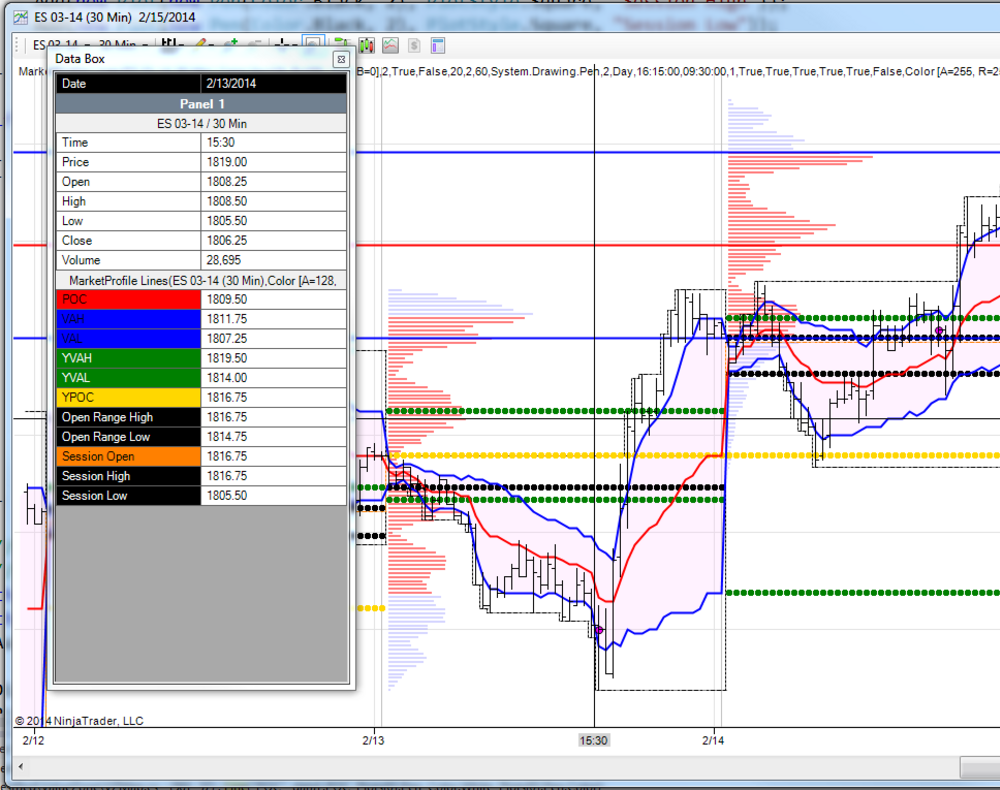
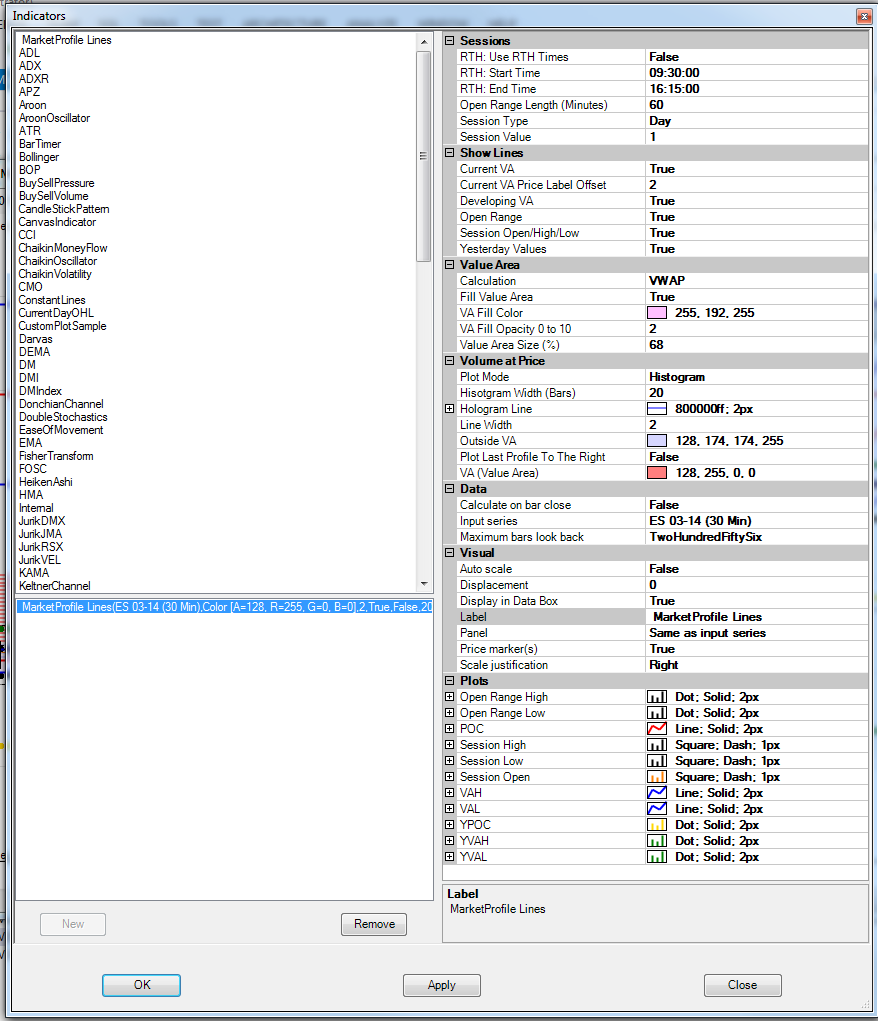
Market Profile Lines
Show Volume histogram and Developing Value area and POC (Point of control).
- Install Package for NinjaTrader 8 - Beta (Include 7 days free trial)
- Install Package for NinjaTrader 7 (Include 7 days free trial)
- Purchase now for $249 (through PayPal)
Main Features
- Volume Distribution.
- See Value Area/POC as they develop.
- See Previous Value Area/POC Values projected.
- Highly configurable.
Screen Shots
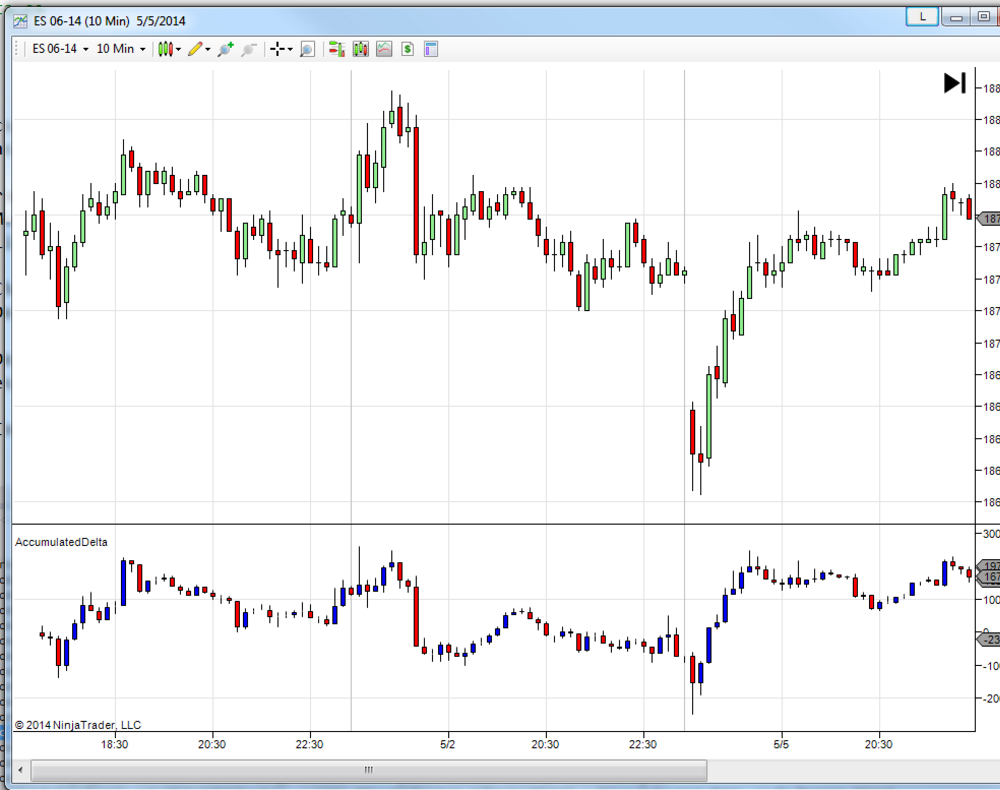
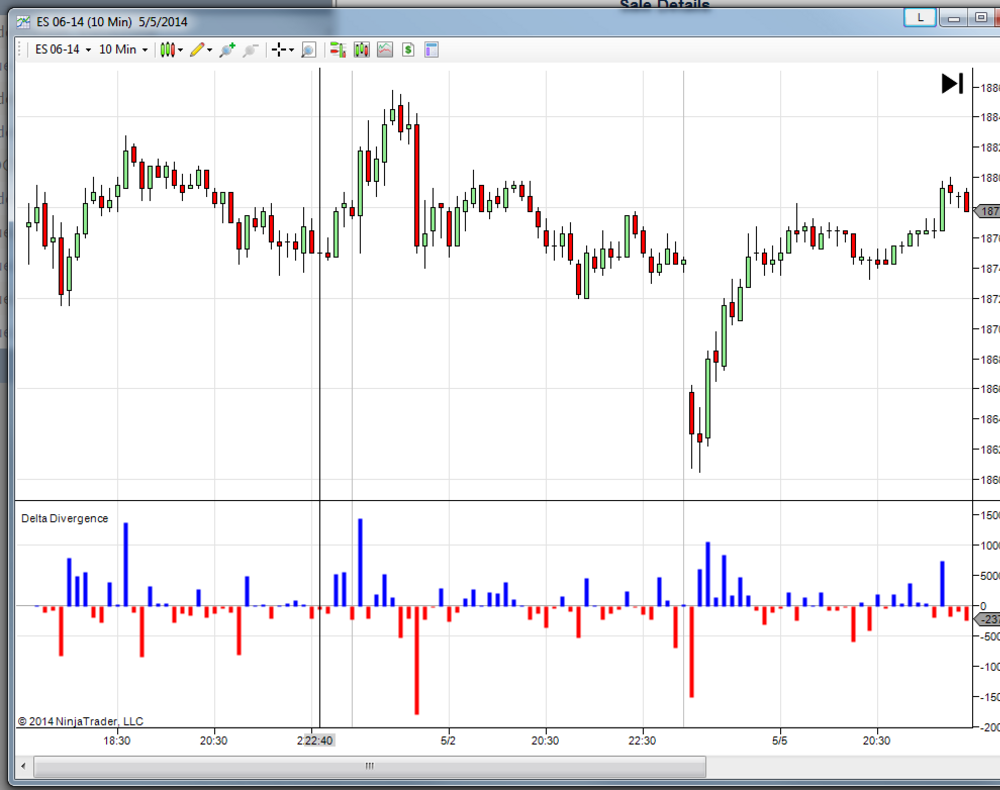
Delta Divergence & Accumulated Delta
Delta describe the net difference between the buying and selling entering the market. It is calculated by subtracting the volume transacted at the bid price from the volume transacted at the ask price. Trades that occur at the ask price are trades that initiated by aggressive buyers. Trades that occur at the bid price are considered to be initiated by aggressive sellers. Thus, a positive delta would reflect more aggressive buying as the result of motivated buyers lifting the ask. A negative delta would reflect more aggressive selling as the result of motivated sellers hitting the bid. Delta Divergence Indicator show the delta of each bar as Histogram Accumulated Delta show the development of delta over the session or between sessions.
- Install Package for NinjaTrader 8 - Beta (Include 7 days free trial)
- Install Package for NinjaTrader 7 (Include 7 days free trial)
- Purchase now for $149 (through PayPal)
Main Features
- Show Delta or Accumulated Delta.
- Filter to see only large transactions (Blocks).
- Show historical data.