
Software Tools and Services for Traders
TPO and Volume Profile Chart Frequently Asked Questions
- Exit NinjaTrader
- Download install package from Here
- Run the just downloaded package, usually by double click the package at the bottom of the browser window
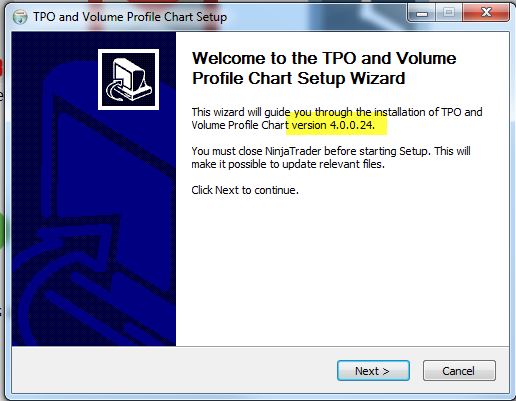
- Follow the installer wizard steps
- Start NinjaTrader
- Open 10 min chart
- Add the indicator (Ctrl-I), should be at the top of the indicator list.
- Note: No need to import anything
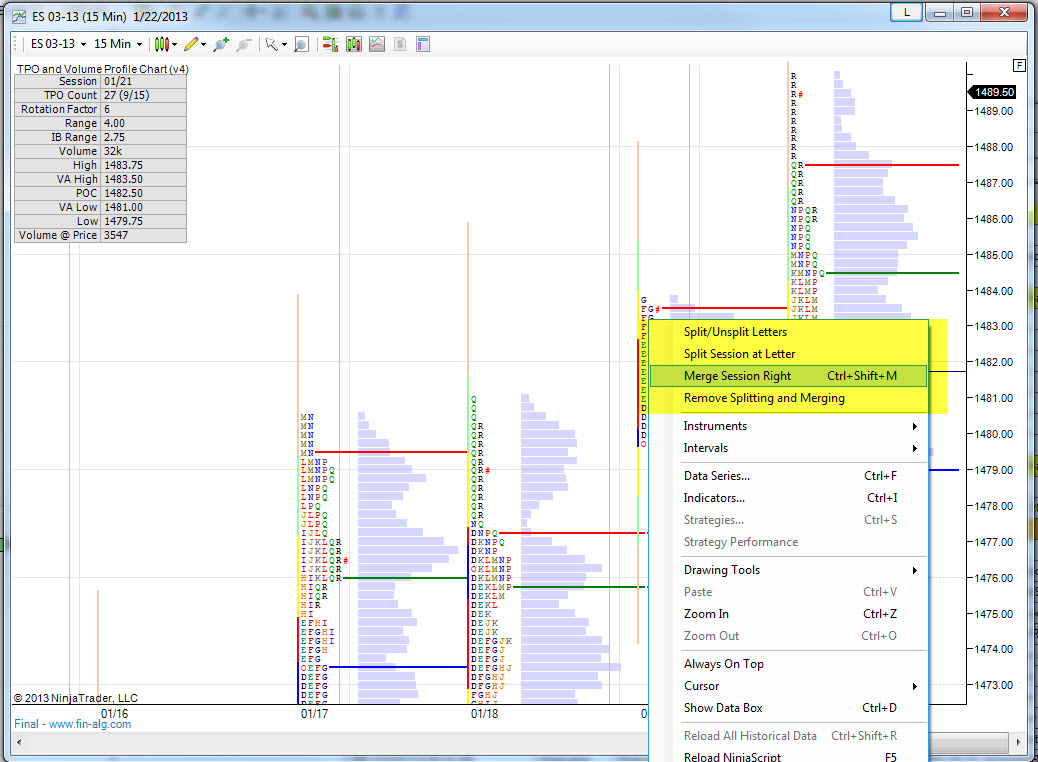
Use the chart context menu (right mouse click)
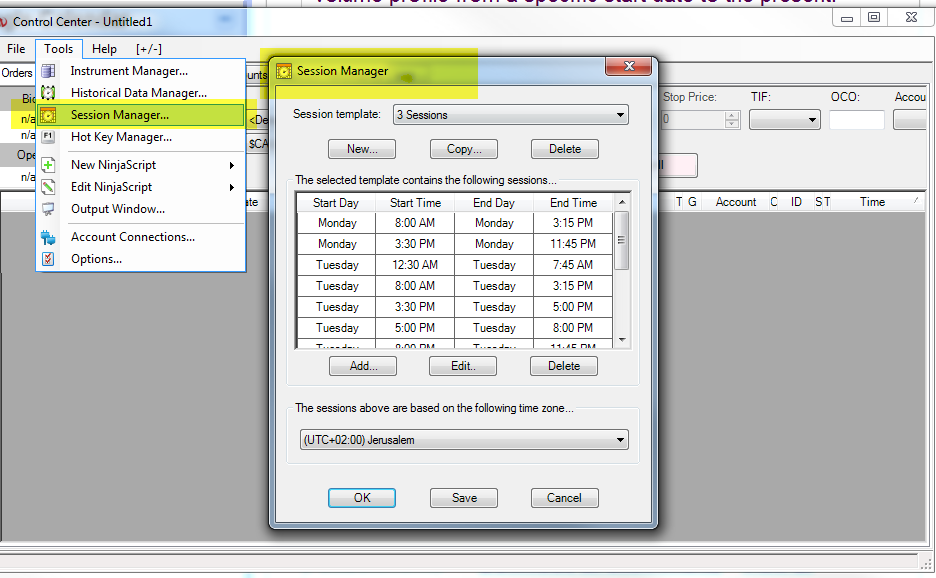
To configure the session times and optionally split the profile for day and night session, use the new NT7 session manager to configure the sessions times.
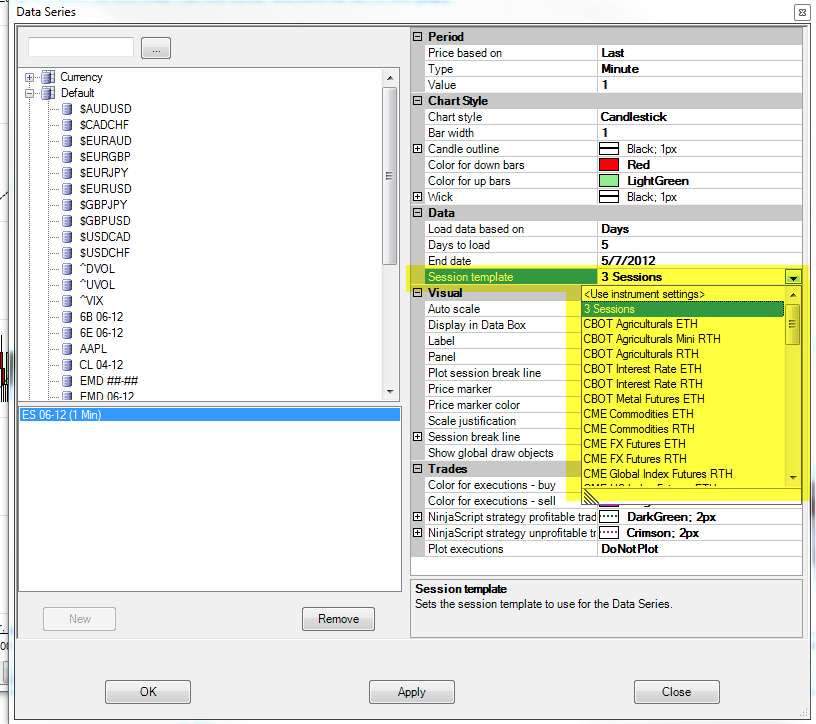
use this session template when you open the chart, TPOChart will use the session information and will build a profile for each session For example, in the session manger you can configure those sessions
- Sunday 4:16 PM to Monday 9:30 AM
- Monday 9:30 AM to Monday 4:15 PM
- Monday 4:16 PM to Tuesday 9:30 AM
And so on
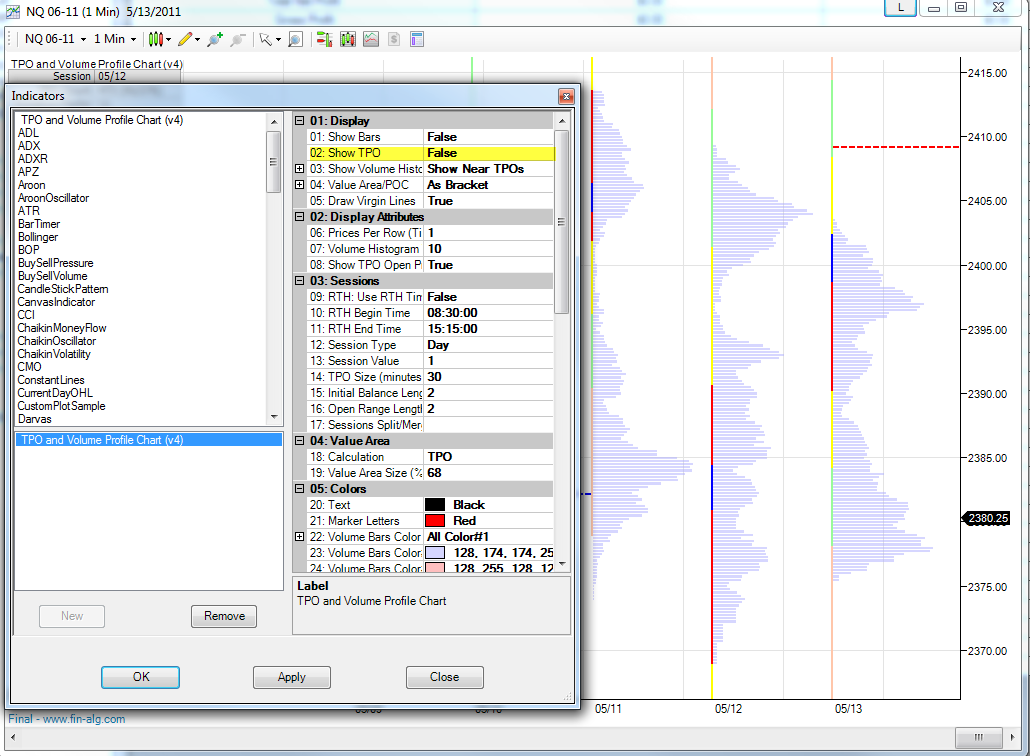
To test this open a normal 10 min chart, make sure you get the correct sessions, The add the TPOChart indicator to the chart and set Show Bars = True so you can see the exact bars of each session.
Set parameter #02 Show TPO = False
This is not directly supported but you can:
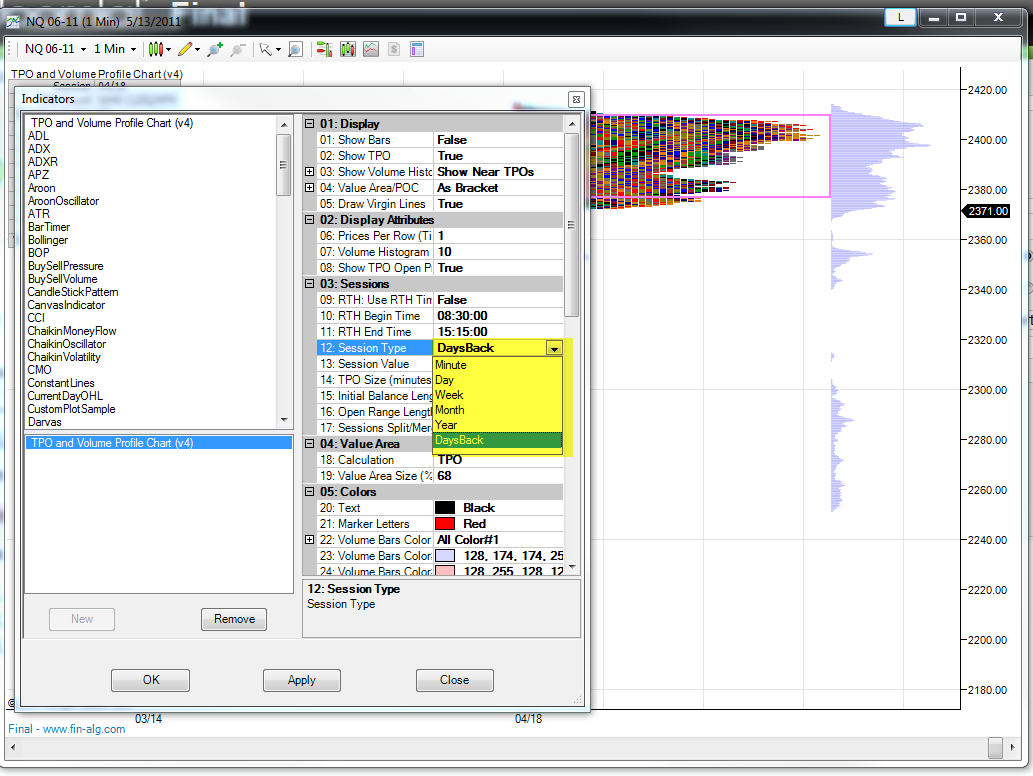
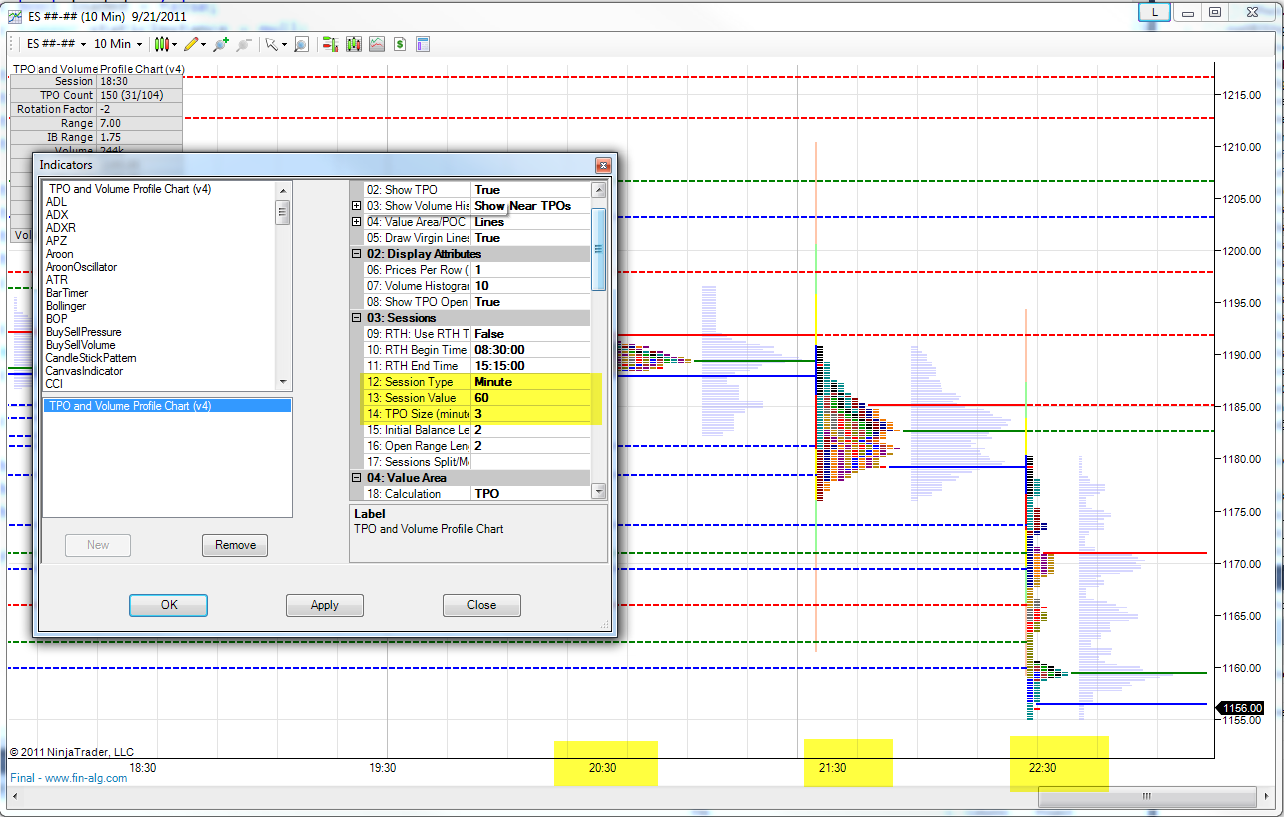
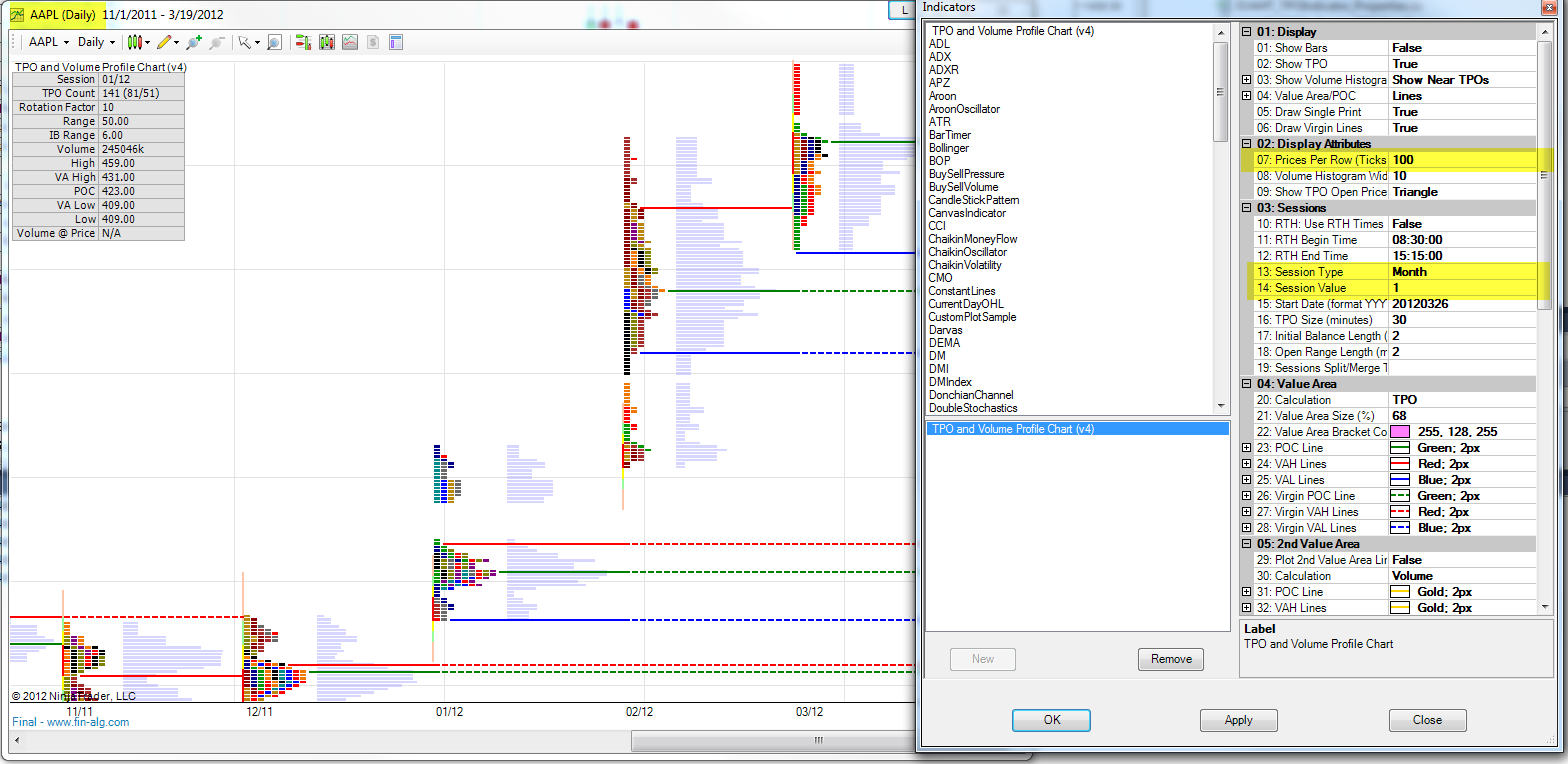
- Display long term profiles like weekly/monthly/yearly profiles (See paramter Session Type)
- Display profile for say 180 days back (paramter Session Type = DaysBack and Session Value = 180)
- Merge profiles manually
To Scroll, use Ctrl-Click on the right side price panel and drag the mouse to reposition
To resize you can click on the right side price panel and drag to change the scale.
A box with an "F" (Fixed) will appear in the upper right corner of the chart margin anytime the vertical chart axis is manually adjusted. This signifies the chart axis is set to a "fixed" scale. Left mouse click this button to return to auto scale.
Also to control how many ticks each letter represent you can modify the value of "Prices per Row (Ticks)" try set it to 4 or 10 this can help to better fit the letters into the chart.
On the indicator properties set "01: Show Bars" = True
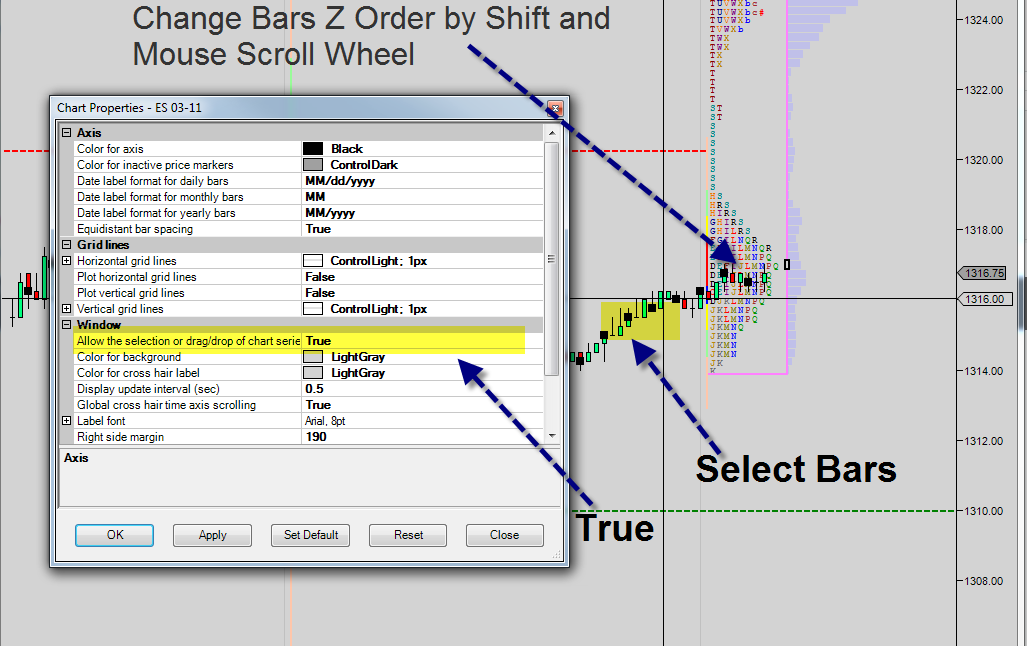
Then to configure the normal chart bars to plot above the profiles you need to change the Z Order of the bars, to do it:
Make sure the bars are selectable, got to chart properties (Ctrl-T) and set "Allow the selection or drag/drop of chart series" = true
Select the bars by click on them
Use the Shift and Mouse scroll wheel to change the bars Z order until they plot above the graphics
Other options for Volume Bars Color Mode are One Color and Gradient
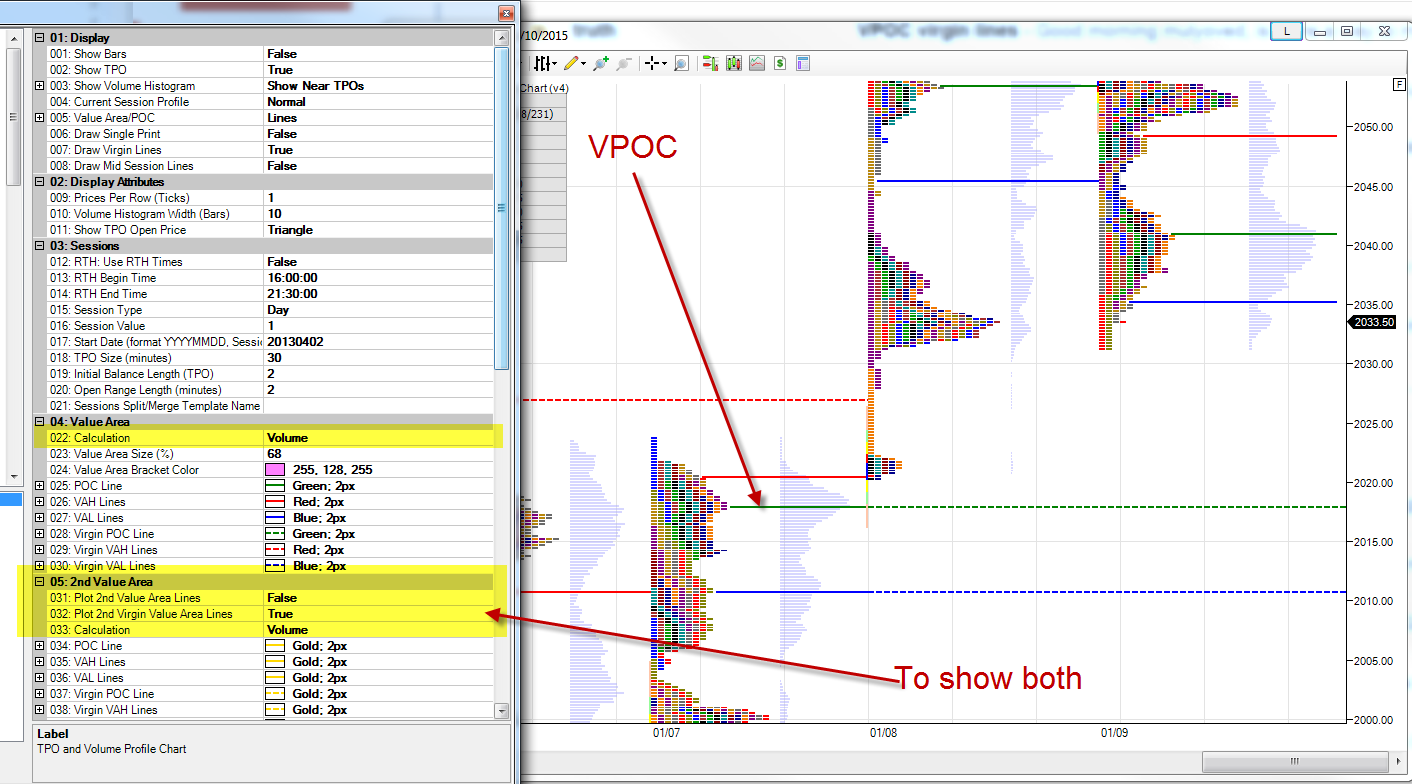
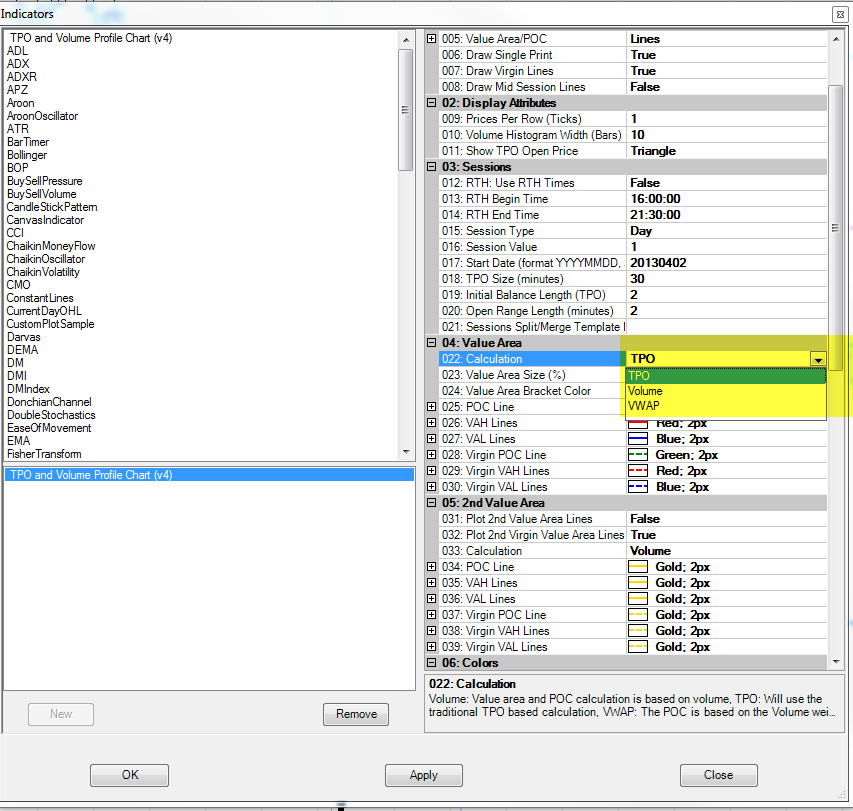
Set Value Area Calculation type to Volume, see image, if you want to show both you can use the "2nd Value Area" options.
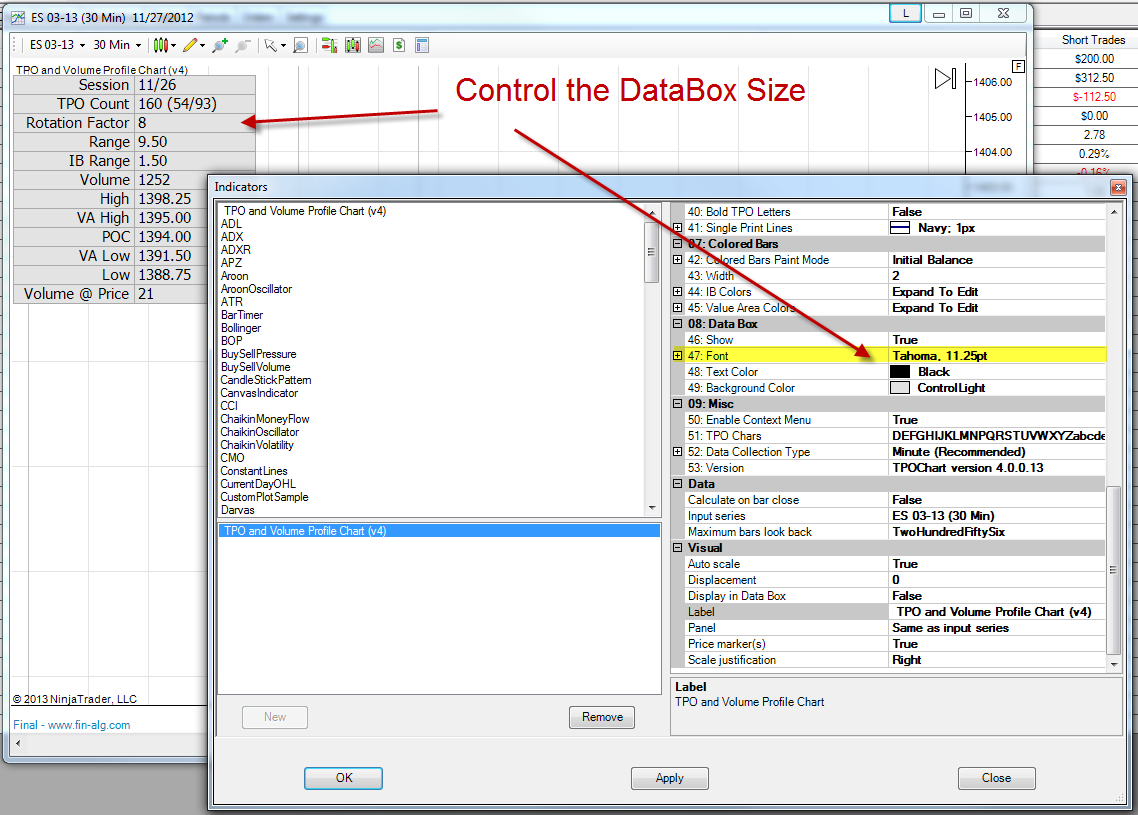
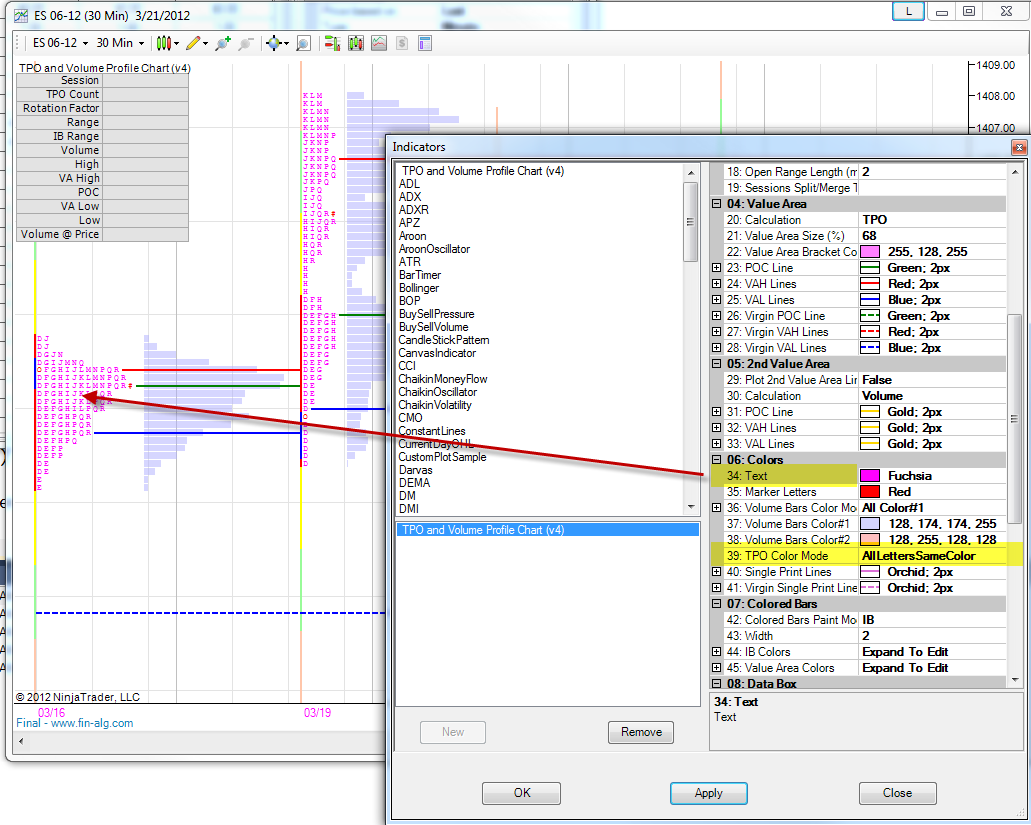
Change the font size of the data box to control the font and data box size, see image
TPOChart is based on NinjaTrader data, to analyze the problem:
- Open new normal 10 min chart, make sure you get all the data if not, use the chart context menu to realod history
- Add the TPOChart Indicator to the chart, don't use the template, just add the indicator to the chart
- Set Show Bars (Overlay) = True, this will show the chart bars, see if you still get all the bars for the missing days
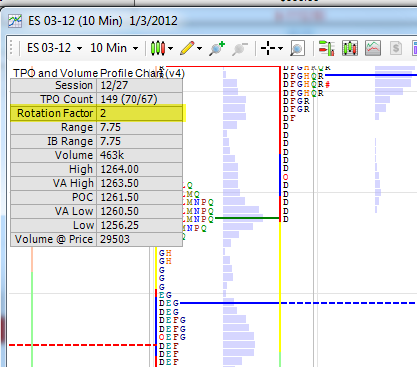
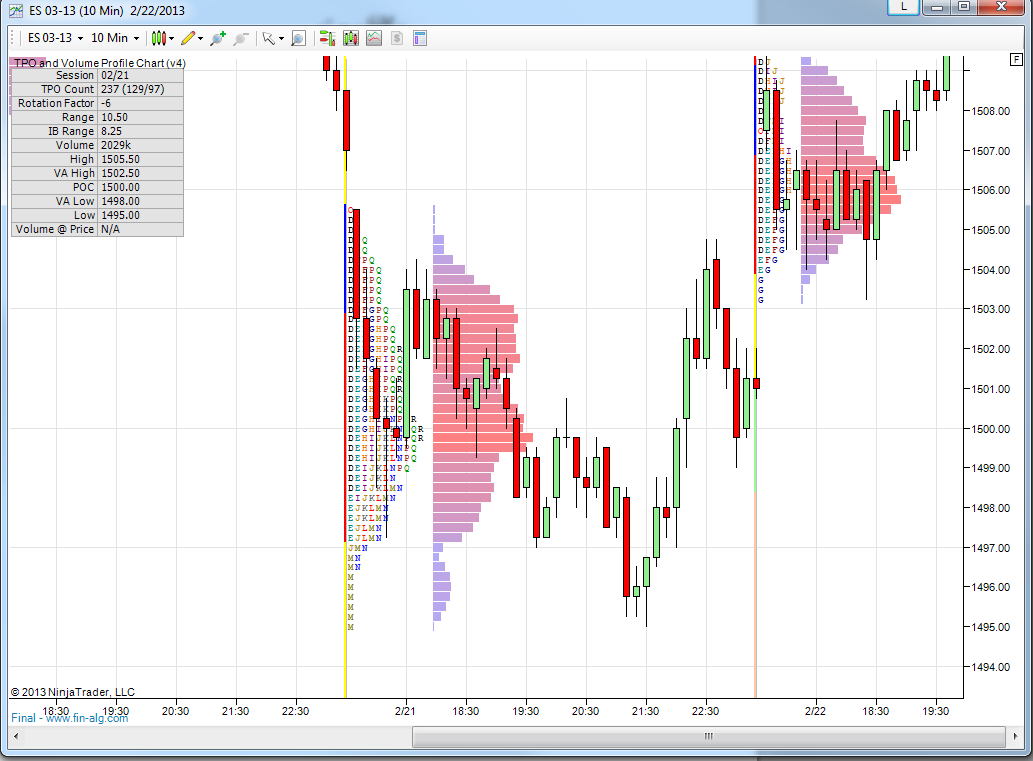
Rotation Factor - Each letter is given a +1 if it's high is above high of previous letter, and a -1 if it's high is below high of previous letter. In addition, a +1 or -1 is added based on whether the low was above or below the previous low. Each letters RF (anywhere from -2 to +2) is summed to provide the RF of the profile.
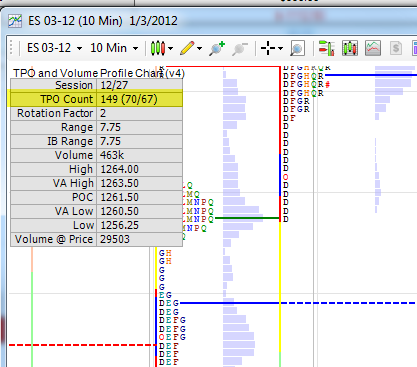
Total number of letters, and in brackets, above /below the POC.
Three calculation methods are supported,
- TPO is the classic original Steidlmayer method to take the price with the largest amount of TPO (POC) and then go up and down until 68% of the TPO are included
- Volume is based only on volume, take the price that has the largest volume and do up and down until 68% of the volume is included.
- VWAP is a more modern calculation that start fromVWAPwhich is a weighted average of the price based on volume
Initial Balance is drawn on bar to the left of the profile, usually you select 2 to draw the 1st trading hour range called initial balance (2 TPO = 60 min) some studies use it for support and resistance levels as well as 150% and 200% of this range.
If you want to save for same instrument different split you need to give each other different name, otherwise you can leave it empty
Say Sensitivity is 10, To qualify a price level to be HVN volume at price need to be higher then the volume of each of the 10 ticks above it and each of the 10 ticks below it.
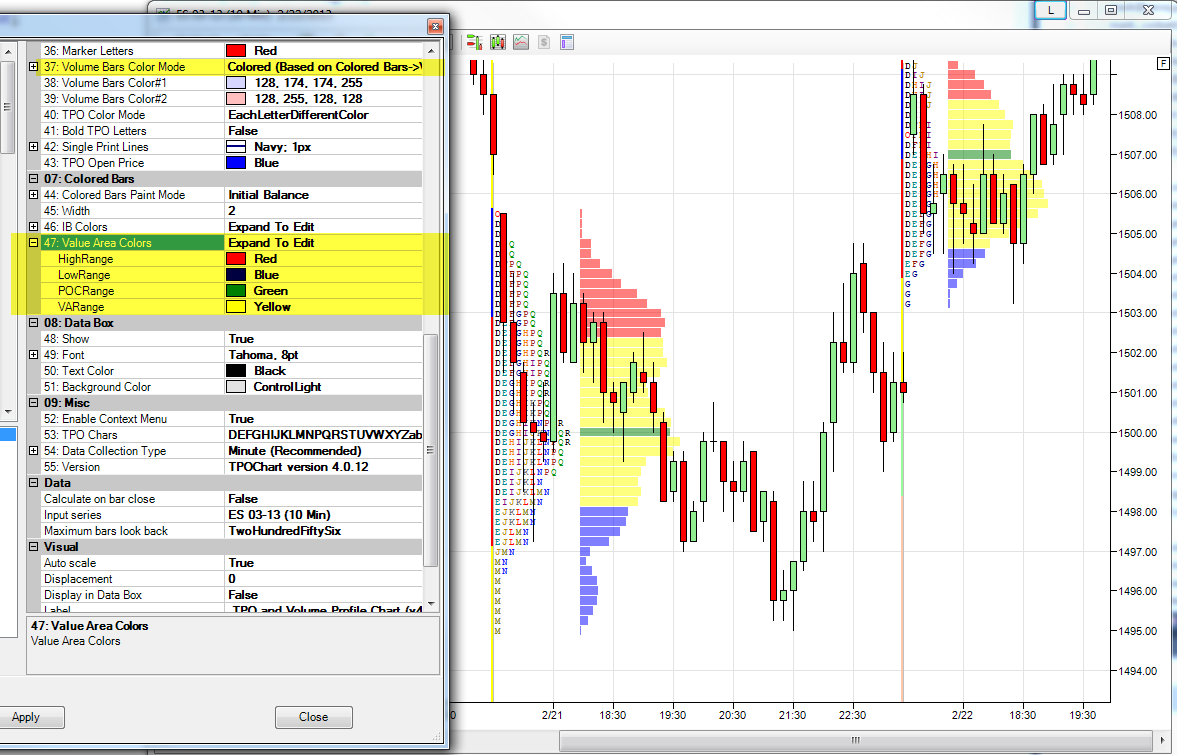
Right now letters colors are hard coded, can change all of them to diffrent color or use the predefined color schema, to change:
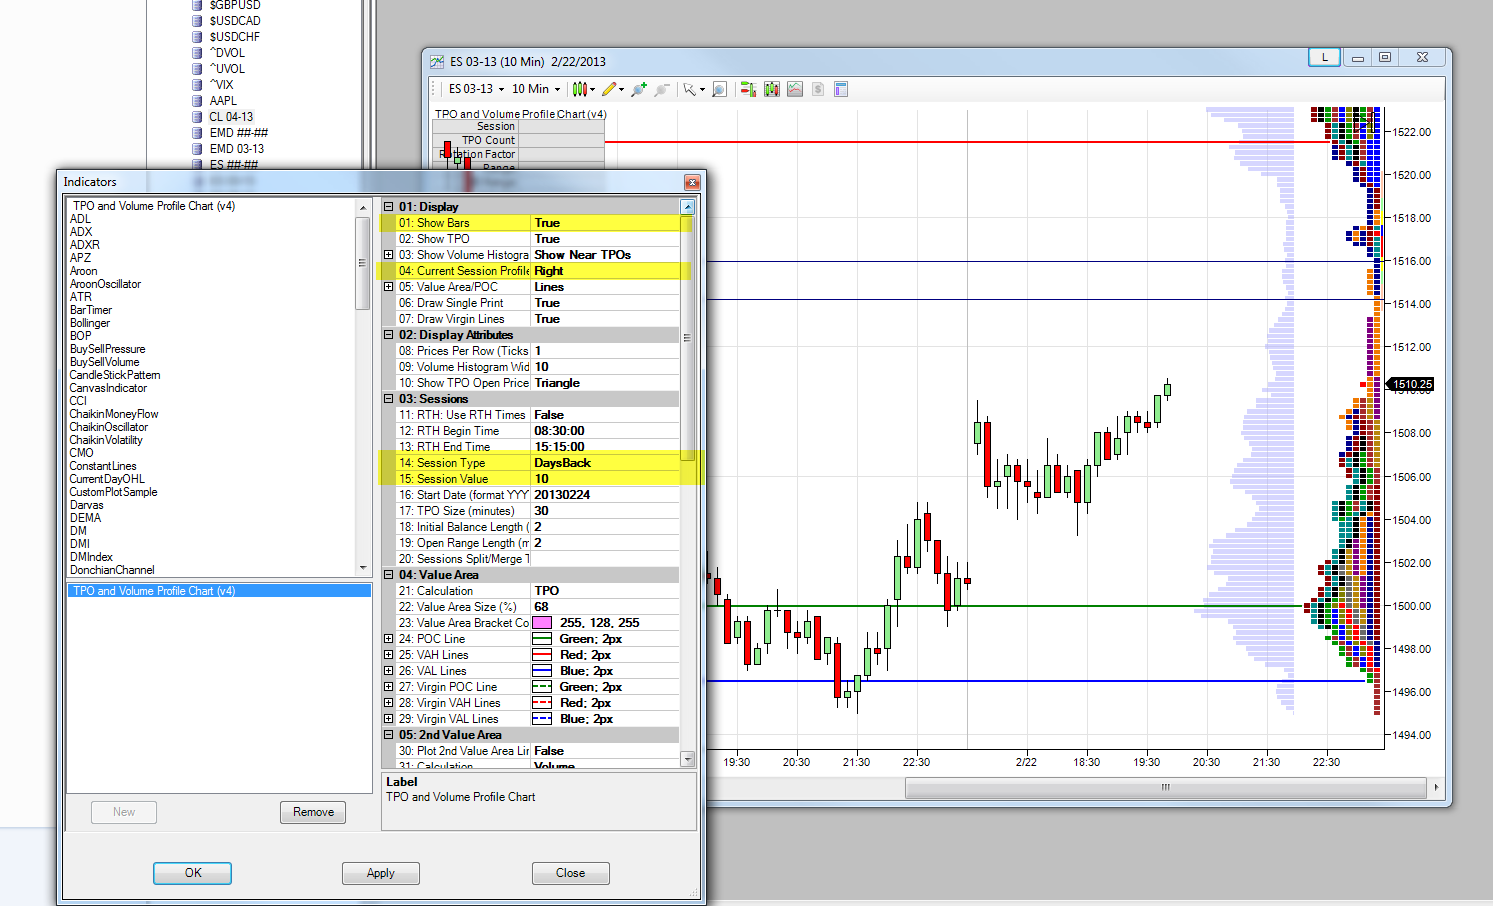
Set session Type = Date
Set Start Date
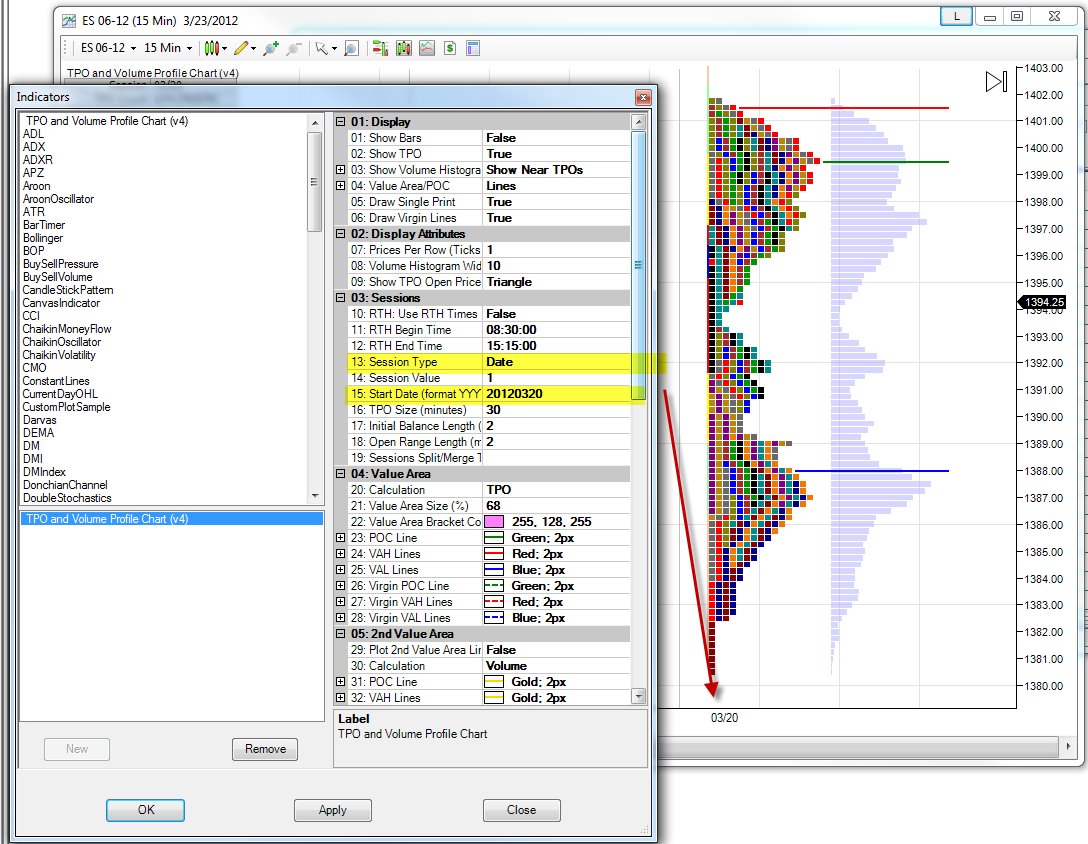
See image for recommended setup
Any data feed that work with NinjatTrader will be fine for TPOChart
Usually TPOChart need 1 min data, for extra accuracy tot he calculation of the volume profile 1 tick data can be used (configurable)
Can be used to get more accurate volume profile, does not recommended as it take more CPU and the difference in the volume calculation is not significant
Latest version can always be found in Products page
Updates notifications are posted to thisFacebook Page
On the Installer when installing the package
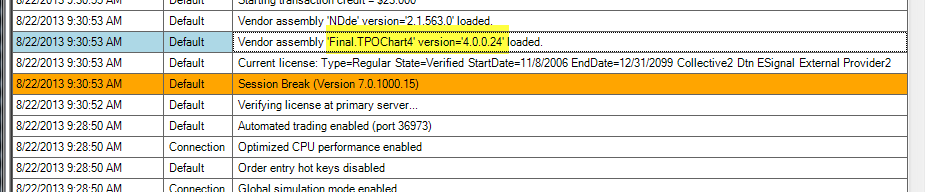
On NinjaTrader log
Yes, you can use TPOChar on up to two PC for the price of one license
- Confirm the installation was working correctly by checking the folder Documents\NinjaTrader 7\bin\Custom and make sure you have a file Final.TPOChart.dll
- If not exit NinjaTrader, make sure AntiVirus is disabled and run the installer again
- If still cannot find it check if the dll was installed under different user, users can be found under "C:\Users\" and you should check each "C:\Users\\[user]\Documents\NinjaTrader 7\bin\Custom" folder for the dll, in that case try to install again and make sure to install to the correct user or you can just copy the dll to the right user.
- After starting NinjaTrader check the NinjaTrader log and make sure DLL was loaded correctly, look for a line that say "Vendor assembly 'Final.TPOChart' version='4.0.0.22' loaded"
- Open the indicator list and look for " TPO and Volume Profile Chart (v4)", Notice it should be at the top of the list as there is a leading space to the name.
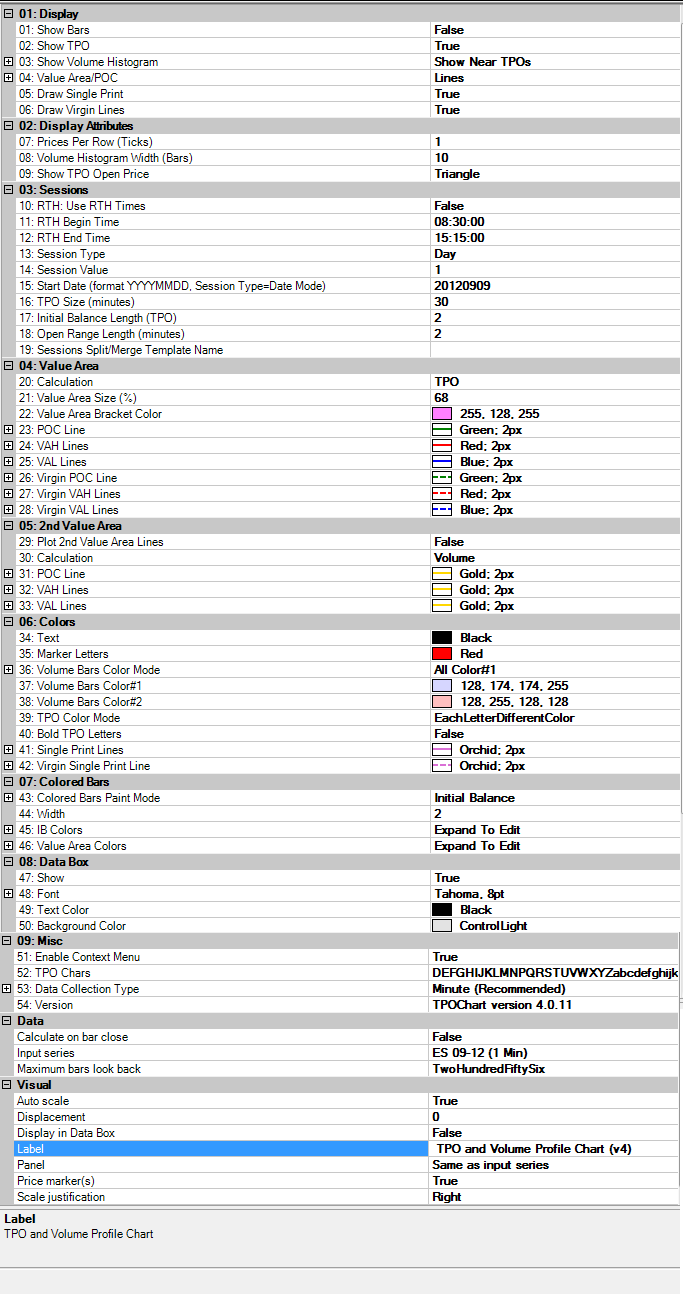
List of available configurable parameters
Start from here Trading Nakedand Free TPO Class JPJTrading